29
/
en
AIzaSyAYiBZKx7MnpbEhh9jyipgxe19OcubqV5w
April 1, 2024
97025
Cabo Verde
CPV
true
2
1
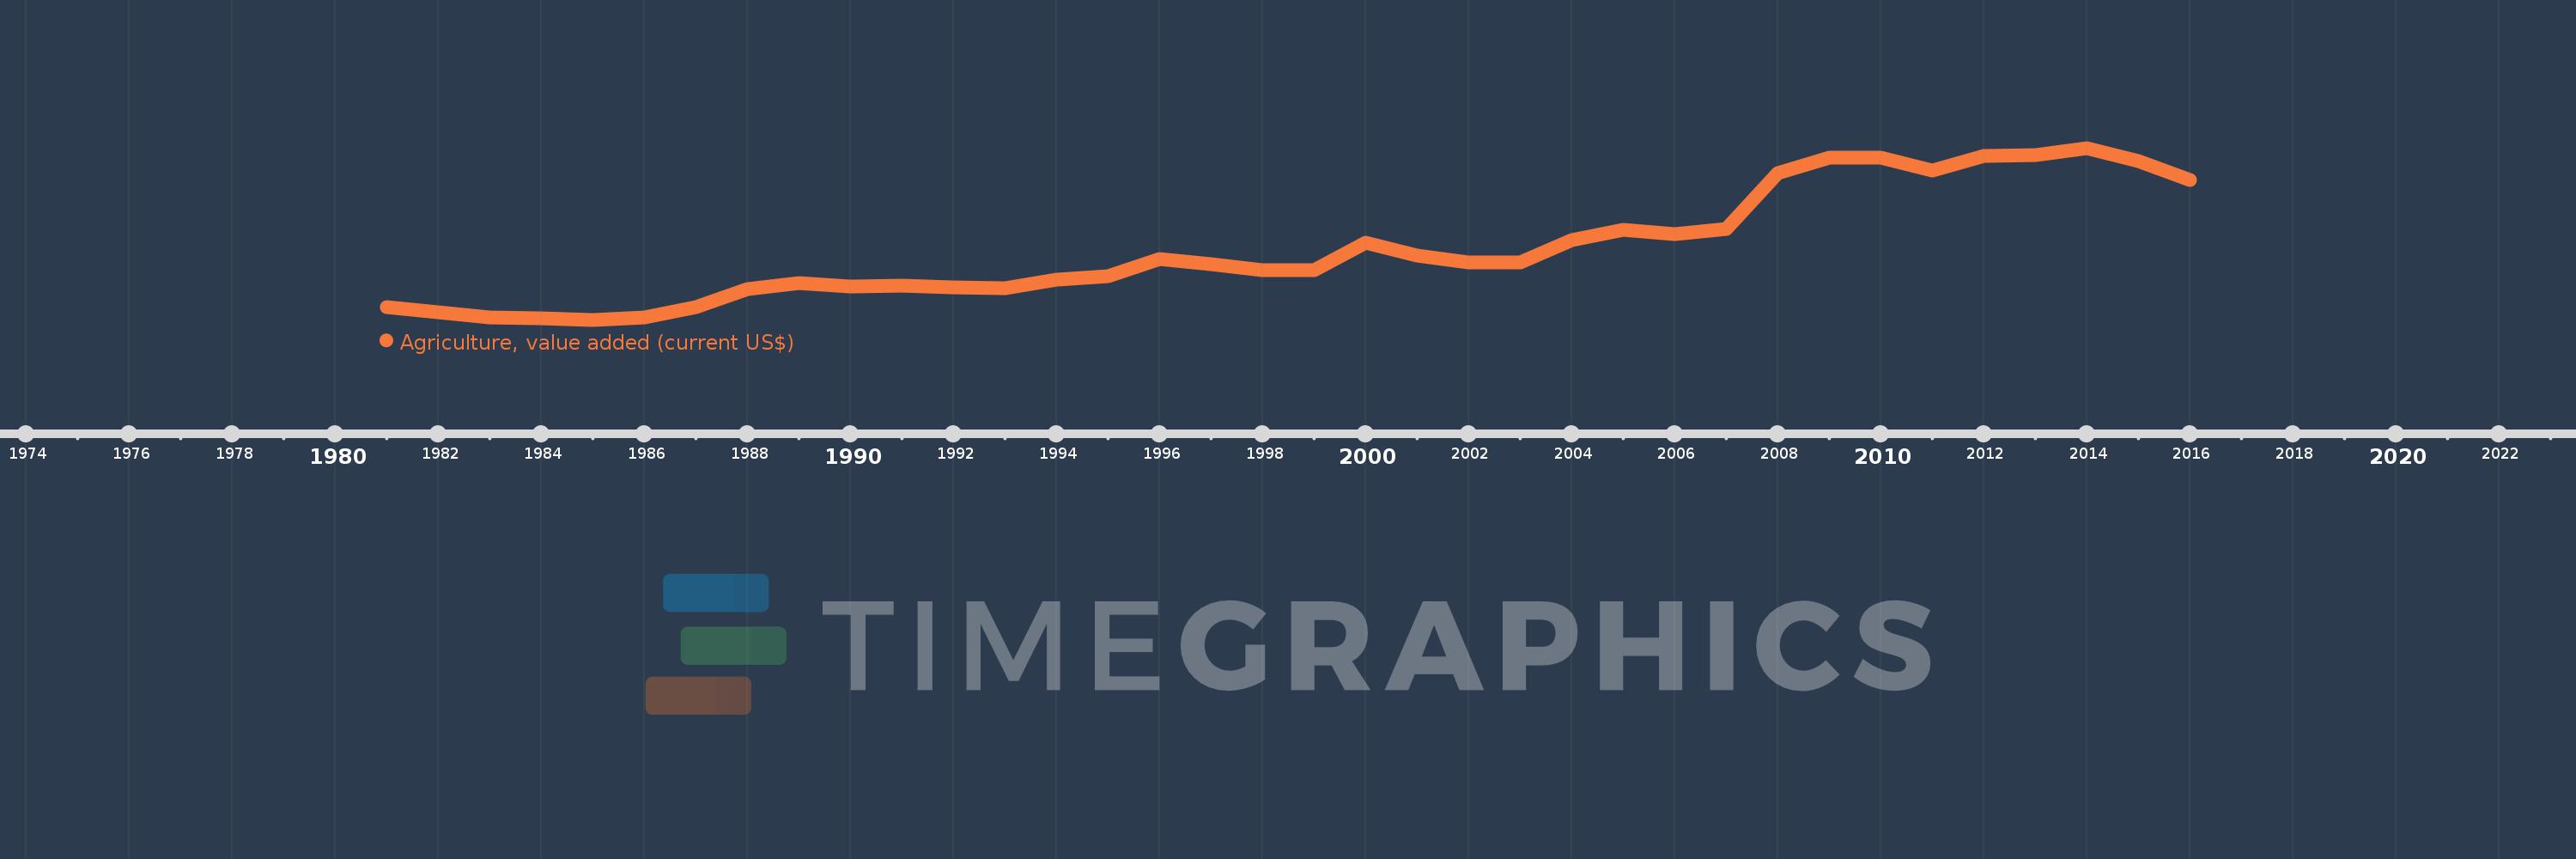
Agriculture, value added (current US$)
2016,2015,2014,2013,2012,2011,2010,2009,2008,2007,2006,2005,2004,2003,2002,2001,2000,1999,1998,1997,1996,1995,1994,1993,1992,1991,1990,1989,1988,1987,1986,1985,1984,1983,1982,1981
This statistics in other country:
AfghanistanAlbaniaAlgeriaAndorraAngolaAntigua and BarbudaArab WorldArgentinaArmeniaArubaAustraliaAustriaAzerbaijanBahamas, TheBahrainBangladeshBarbadosBelarusBelgiumBelizeBeninBermudaBhutanBoliviaBosnia and HerzegovinaBotswanaBrazilBrunei DarussalamBulgariaBurkina FasoBurundiCabo VerdeCambodiaCameroonCanadaCaribbean small statesCayman IslandsCentral African RepublicCentral Europe and the BalticsChadChileChinaColombiaComorosCongo, Dem. Rep.Congo, Rep.Costa RicaCote d'IvoireCroatiaCubaCyprusCzech RepublicDenmarkDjiboutiDominicaDominican RepublicEarly-demographic dividendEast Asia & PacificEast Asia & Pacific (excluding high income)East Asia & Pacific (IDA & IBRD countries)EcuadorEgypt, Arab Rep.El SalvadorEquatorial GuineaEritreaEstoniaEthiopiaEuro areaEurope & Central AsiaEurope & Central Asia (excluding high income)Europe & Central Asia (IDA & IBRD countries)European UnionFijiFinlandFragile and conflict affected situationsFranceFrench PolynesiaGabonGambia, TheGeorgiaGermanyGhanaGreeceGrenadaGuatemalaGuineaGuinea-BissauGuyanaHeavily indebted poor countries (HIPC)High incomeHondurasHong Kong SAR, ChinaHungaryIBRD onlyIcelandIDA & IBRD totalIDA blendIDA onlyIDA totalIndiaIndonesiaIran, Islamic Rep.IraqIrelandItalyJamaicaJapanJordanKazakhstanKenyaKiribatiKorea, Rep.KosovoKuwaitKyrgyz RepublicLao PDRLate-demographic dividendLatin America & Caribbean Latin America & Caribbean (excluding high income)Latin America & the Caribbean (IDA & IBRD countries)LatviaLeast developed countries: UN classificationLebanonLesothoLiberiaLibyaLithuaniaLow & middle incomeLow incomeLower middle incomeLuxembourgMacao SAR, ChinaMacedonia, FYRMadagascarMalawiMalaysiaMaldivesMaliMaltaMarshall IslandsMauritaniaMauritiusMexicoMicronesia, Fed. Sts.Middle East & North AfricaMiddle East & North Africa (excluding high income)Middle East & North Africa (IDA & IBRD countries)Middle incomeMoldovaMongoliaMontenegroMoroccoMozambiqueMyanmarNamibiaNepalNetherlandsNew CaledoniaNew ZealandNicaraguaNigerNigeriaNorth AmericaNorwayOECD membersOmanOther small statesPakistanPalauPanamaPapua New GuineaParaguayPeruPhilippinesPolandPortugalPost-demographic dividendPre-demographic dividendPuerto RicoQatarRomaniaRussian FederationRwandaSamoaSao Tome and PrincipeSaudi ArabiaSenegalSerbiaSeychellesSierra LeoneSingaporeSlovak RepublicSloveniaSmall statesSolomon IslandsSouth AfricaSouth AsiaSouth Asia (IDA & IBRD)SpainSri LankaSt. Kitts and NevisSt. LuciaSt. Vincent and the GrenadinesSub-Saharan Africa Sub-Saharan Africa (excluding high income)Sub-Saharan Africa (IDA & IBRD countries)SudanSurinameSwazilandSwedenSwitzerlandSyrian Arab RepublicTajikistanTanzaniaThailandTimor-LesteTogoTongaTrinidad and TobagoTunisiaTurkeyTurkmenistanTuvaluUgandaUkraineUnited Arab EmiratesUnited KingdomUnited StatesUpper middle incomeUruguayUzbekistanVanuatuVenezuela, RBVietnamWest Bank and GazaWorldYemen, Rep.ZambiaZimbabwe Timeline:
This timeline shows a graph from 1981 to 2016 of Cabo Verde. No data until 1980. Number of actual observations by date: 36.
Source name:
World Development Indicators
Source organization:
World Bank national accounts data, and OECD National Accounts data files.
Categories, topics:
Agriculture & Rural Development, Economy & Growth
Last updated:
apr 23, 2017
Indicators value changes by year
Minimum:
15.653 mln
jan 1, 1985
Maximum:
160.403 mln
jan 1, 2014
At the date of observation
Value
Absolute change
Change from previous value
jan 1, 1981
26.401 mln
+26.401 mln
0.0%
jan 1, 1982
21.998 mln
-4.403 mln
-16.68%
jan 1, 1983
17.692 mln
-4.306 mln
-19.58%
jan 1, 1984
16.696 mln
-995.688K
-5.63%
jan 1, 1985
15.653 mln
-1.043 mln
-6.25%
jan 1, 1986
17.89 mln
+2.238 mln
14.29%
jan 1, 1987
25.988 mln
+8.098 mln
45.26%
jan 1, 1988
41.514 mln
+15.525 mln
59.74%
jan 1, 1989
46.774 mln
+5.26 mln
12.67%
jan 1, 1990
43.356 mln
-3.418 mln
-7.31%
jan 1, 1991
44.164 mln
+808.057K
1.86%
jan 1, 1992
42.834 mln
-1.329 mln
-3.01%
jan 1, 1993
42.124 mln
-710.178K
-1.66%
jan 1, 1994
49.711 mln
+7.587 mln
18.01%
jan 1, 1995
52.282 mln
+2.571 mln
5.17%
jan 1, 1996
66.645 mln
+14.363 mln
27.47%
jan 1, 1997
62.489 mln
-4.156 mln
-6.24%
jan 1, 1998
57.306 mln
-5.182 mln
-8.29%
jan 1, 1999
57.135 mln
-171.437K
-0.3%
jan 1, 2000
80.826 mln
+23.691 mln
41.46%
jan 1, 2001
69.408 mln
-11.417 mln
-14.13%
jan 1, 2002
64.274 mln
-5.135 mln
-7.4%
jan 1, 2003
64.28 mln
+6.467K
0.01%
jan 1, 2004
82.566 mln
+18.286 mln
28.45%
jan 1, 2005
91.17 mln
+8.604 mln
10.42%
jan 1, 2006
87.489 mln
-3.68 mln
-4.04%
jan 1, 2007
92.162 mln
+4.673 mln
5.34%
jan 1, 2008
138.905 mln
+46.743 mln
50.72%
jan 1, 2009
152.179 mln
+13.274 mln
9.56%
jan 1, 2010
152.152 mln
-26.745K
-0.02%
jan 1, 2011
141.475 mln
-10.677 mln
-7.02%
jan 1, 2012
153.974 mln
+12.499 mln
8.84%
jan 1, 2013
154.376 mln
+401.711K
0.26%
jan 1, 2014
160.403 mln
+6.027 mln
3.9%
jan 1, 2015
149.651 mln
-10.752 mln
-6.7%
jan 1, 2016
133.292 mln
-16.359 mln
-10.93%
Ranking of countries by current statistics by years


Comments: