29
/
en
AIzaSyAYiBZKx7MnpbEhh9jyipgxe19OcubqV5w
April 1, 2024
55115
Post-demographic dividend
PST
false
2
1
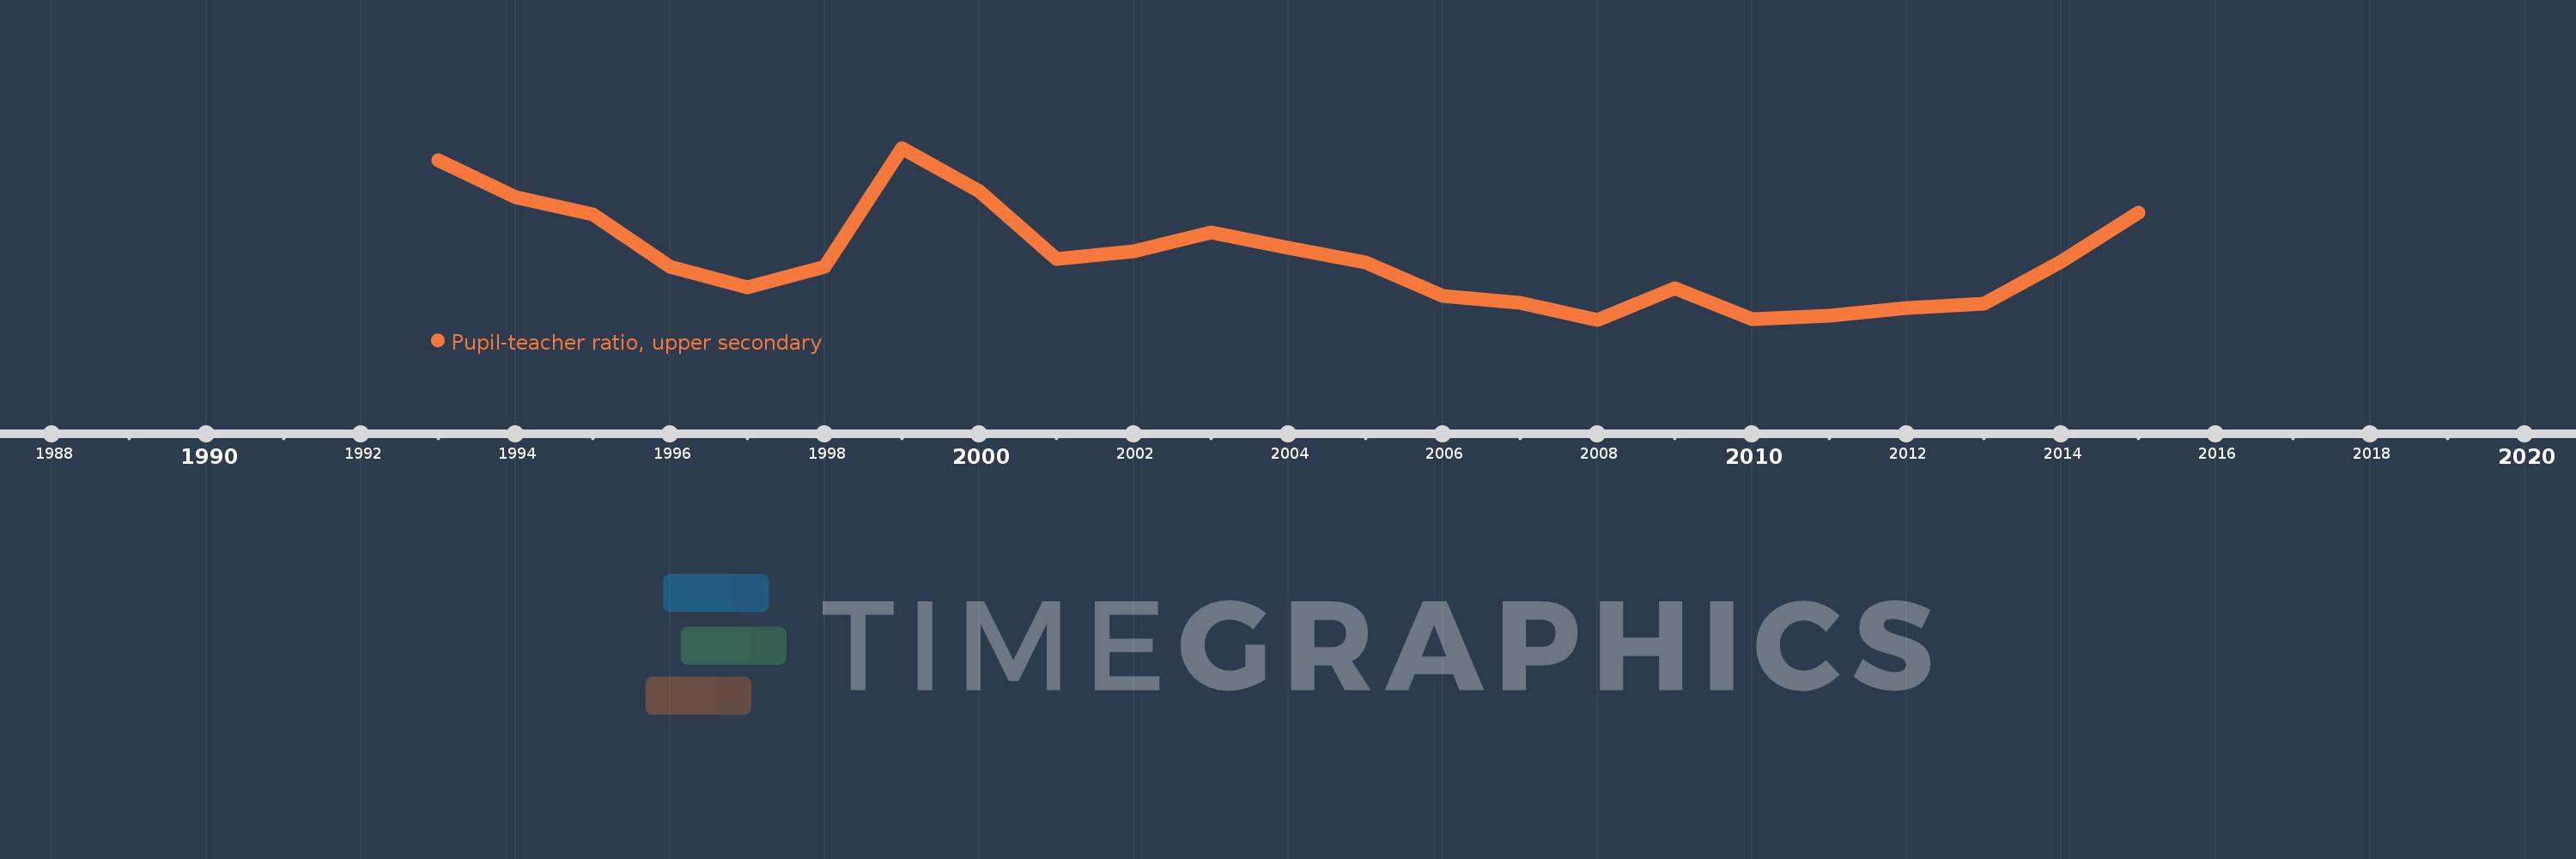
Pupil-teacher ratio, upper secondary
2015,2014,2013,2012,2011,2010,2009,2008,2007,2006,2005,2004,2003,2002,2001,2000,1999,1998,1997,1996,1995,1994,1993
This statistics in other country:
Timeline:
This timeline shows a graph from 1993 to 2015 of Post-demographic dividend. No data until 1992. Number of actual observations by date: 23.
Source name:
World Development Indicators
Source organization:
United Nations Educational, Scientific, and Cultural Organization (UNESCO) Institute for Statistics.
Categories, topics:
Education
Last updated:
apr 23, 2017
Indicators value changes by year
Minimum:
12.528
jan 1, 2008
Maximum:
13.238
jan 1, 1999
At the date of observation
Value
Absolute change
Change from previous value
jan 1, 1993
13.187
+13.187
0.0%
jan 1, 1994
13.033
-0.155
-1.17%
jan 1, 1995
12.963
-0.07
-0.54%
jan 1, 1996
12.748
-0.215
-1.66%
jan 1, 1997
12.661
-0.087
-0.68%
jan 1, 1998
12.746
+0.085
0.67%
jan 1, 1999
13.238
+0.493
3.86%
jan 1, 2000
13.061
-0.177
-1.34%
jan 1, 2001
12.779
-0.282
-2.16%
jan 1, 2002
12.811
+0.032
0.25%
jan 1, 2003
12.89
+0.079
0.61%
jan 1, 2004
12.824
-0.066
-0.52%
jan 1, 2005
12.766
-0.058
-0.45%
jan 1, 2006
12.625
-0.141
-1.1%
jan 1, 2007
12.599
-0.026
-0.21%
jan 1, 2008
12.528
-0.071
-0.56%
jan 1, 2009
12.659
+0.131
1.05%
jan 1, 2010
12.532
-0.127
-1.0%
jan 1, 2011
12.544
+0.012
0.1%
jan 1, 2012
12.578
+0.034
0.27%
jan 1, 2013
12.595
+0.017
0.13%
jan 1, 2014
12.767
+0.172
1.36%
jan 1, 2015
12.972
+0.205
1.61%
Ranking of countries by current statistics by years


Comments: