29
/
en
AIzaSyAYiBZKx7MnpbEhh9jyipgxe19OcubqV5w
April 1, 2024
76604
Bahamas, The
BHS
true
2
1
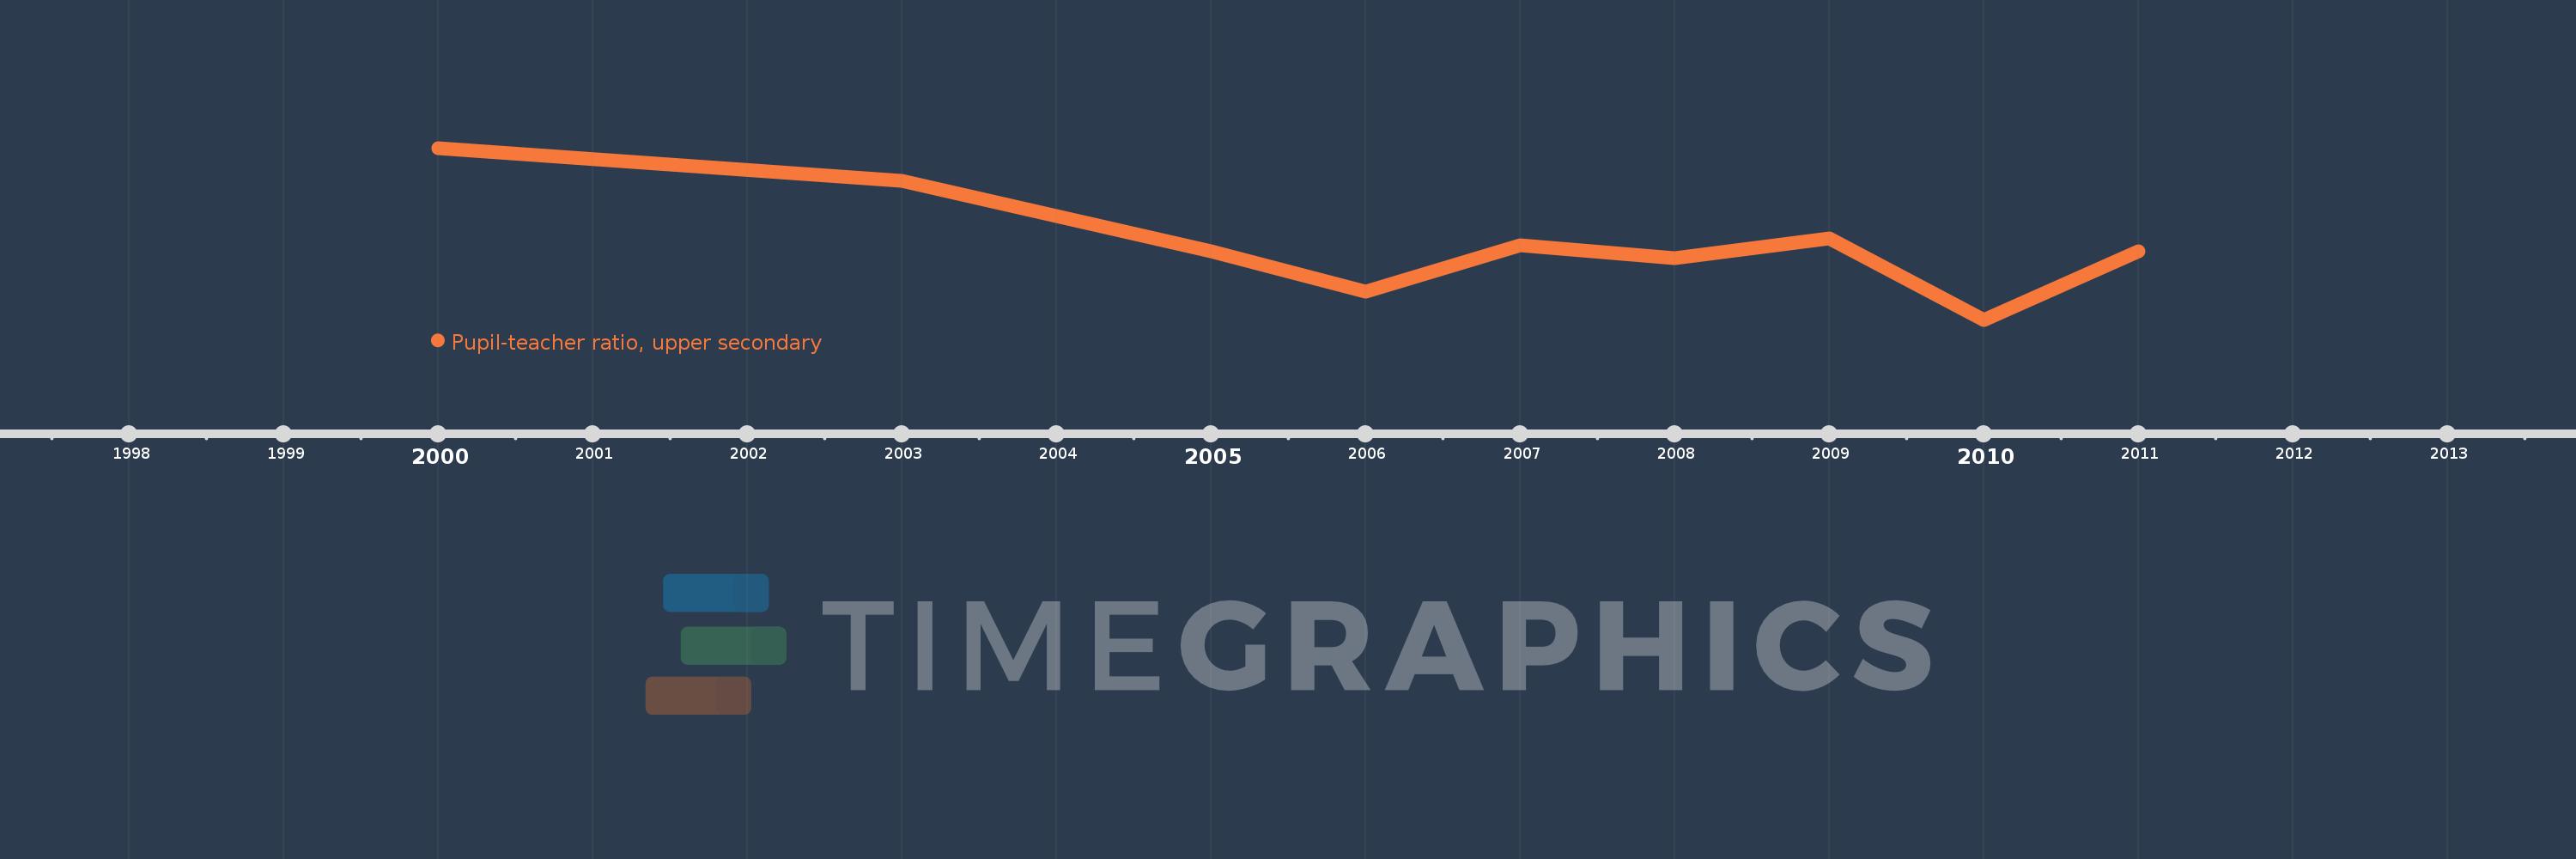
Pupil-teacher ratio, upper secondary
2011,2010,2009,2008,2007,2006,2005,2003,2000
This statistics in other country:
Timeline:
This timeline shows a graph from 2000 to 2011 of Bahamas, The. No data until 1999. Number of actual observations by date: 9.
Source name:
World Development Indicators
Source organization:
United Nations Educational, Scientific, and Cultural Organization (UNESCO) Institute for Statistics.
Categories, topics:
Education
Last updated:
apr 23, 2017
Indicators value changes by year
Minimum:
10.021
jan 1, 2010
Maximum:
15.591
jan 1, 2000
At the date of observation
Value
Absolute change
Change from previous value
jan 1, 2000
15.591
+15.591
0.0%
jan 1, 2003
14.521
-1.07
-6.86%
jan 1, 2005
12.228
-2.292
-15.79%
jan 1, 2006
10.918
-1.31
-10.71%
jan 1, 2007
12.44
+1.521
13.93%
jan 1, 2008
12.011
-0.428
-3.44%
jan 1, 2009
12.663
+0.651
5.42%
jan 1, 2010
10.021
-2.642
-20.87%
jan 1, 2011
12.249
+2.229
22.24%
Ranking of countries by current statistics by years


Comments: