29
/
en
AIzaSyAYiBZKx7MnpbEhh9jyipgxe19OcubqV5w
April 1, 2024
175798
Latvia
LVA
true
2
1
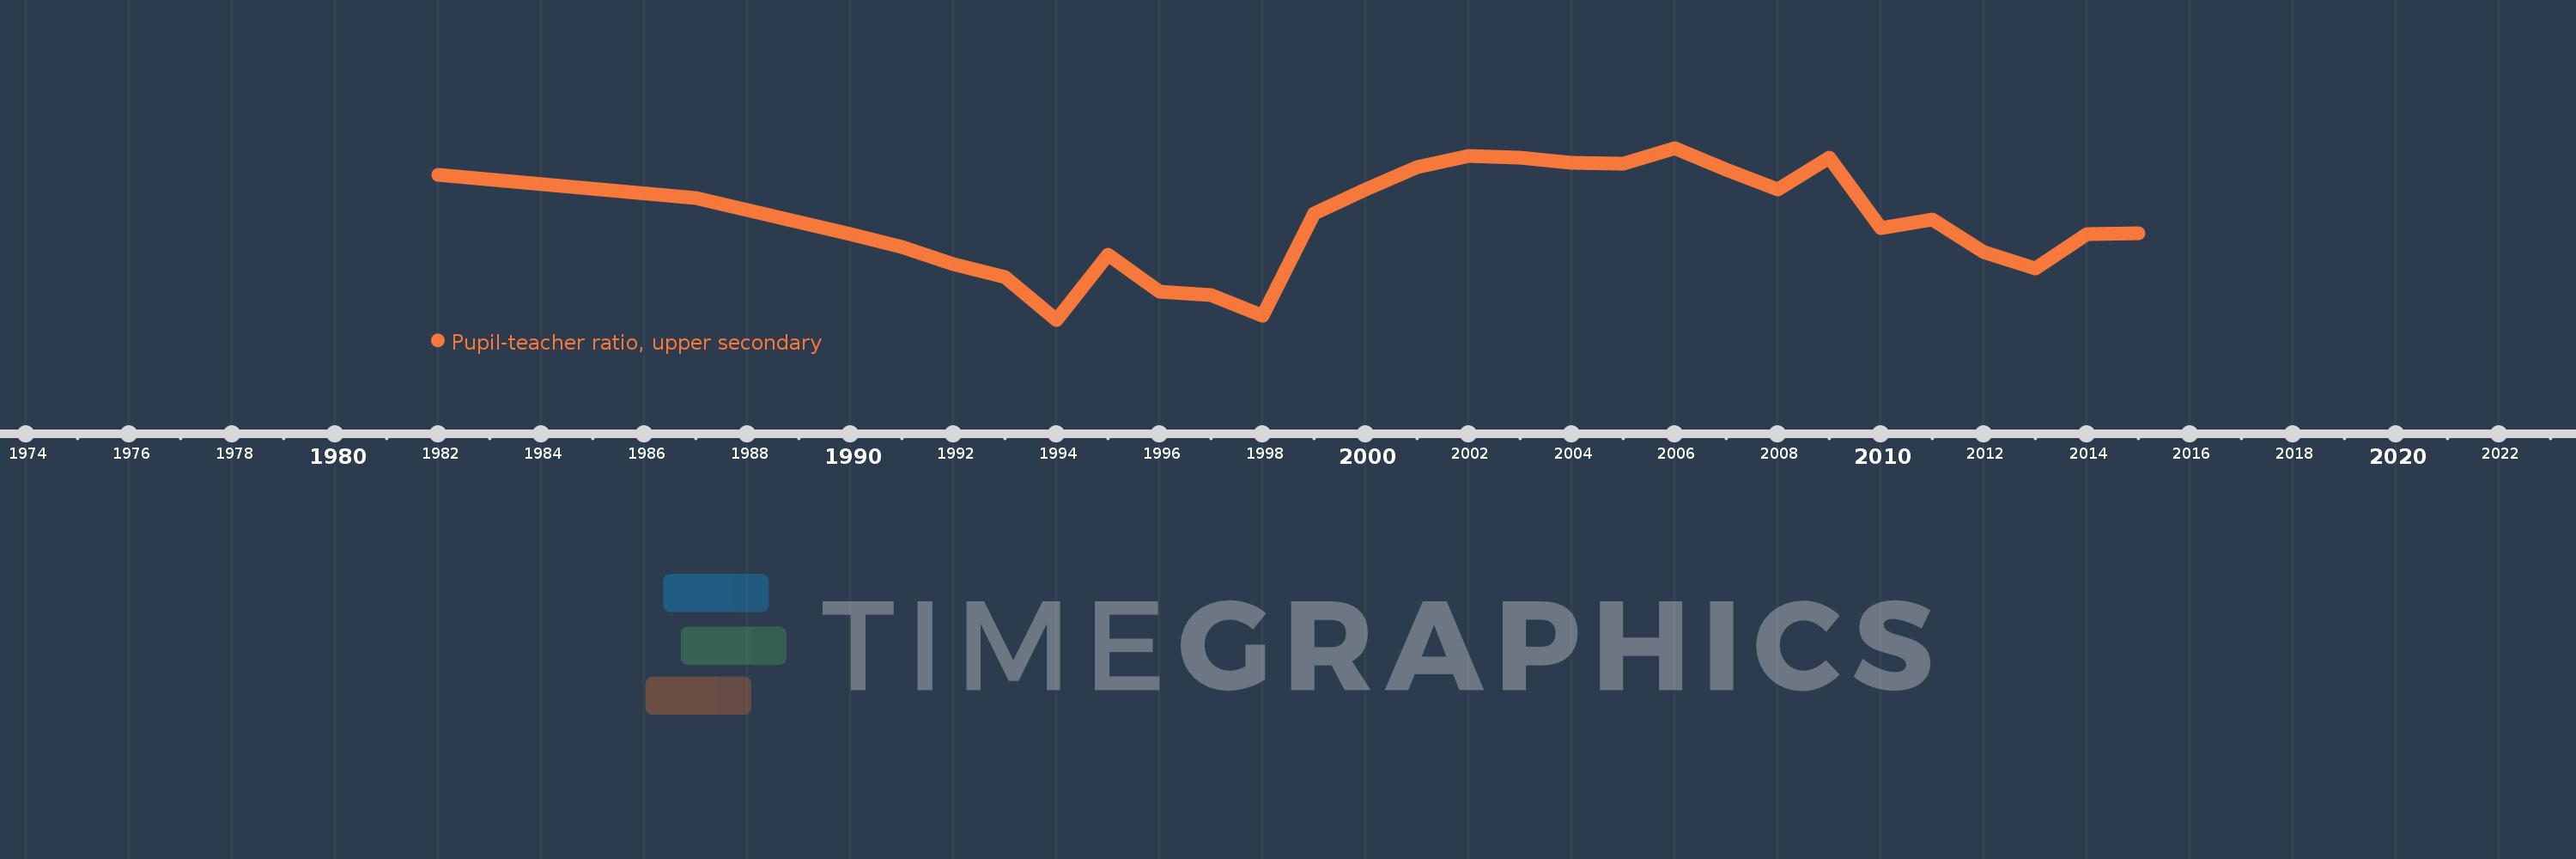
Pupil-teacher ratio, upper secondary
2015,2014,2013,2012,2011,2010,2009,2008,2007,2006,2005,2004,2003,2002,2001,2000,1999,1998,1997,1996,1995,1994,1993,1992,1991,1990,1987,1982
This statistics in other country:
Timeline:
This timeline shows a graph from 1982 to 2015 of Latvia. No data until 1981. Number of actual observations by date: 28.
Source name:
World Development Indicators
Source organization:
United Nations Educational, Scientific, and Cultural Organization (UNESCO) Institute for Statistics.
Categories, topics:
Education
Last updated:
apr 23, 2017
Indicators value changes by year
Maximum:
11.163
jan 1, 2006
At the date of observation
Value
Absolute change
Change from previous value
jan 1, 1982
10.569
+10.569
0.0%
jan 1, 1987
10.053
-0.516
-4.88%
jan 1, 1990
9.261
-0.792
-7.88%
jan 1, 1991
8.978
-0.283
-3.05%
jan 1, 1992
8.604
-0.374
-4.17%
jan 1, 1993
8.311
-0.293
-3.41%
jan 1, 1994
7.368
-0.943
-11.35%
jan 1, 1995
8.805
+1.437
19.51%
jan 1, 1996
7.987
-0.818
-9.29%
jan 1, 1997
7.908
-0.078
-0.98%
jan 1, 1998
7.45
-0.458
-5.79%
jan 1, 1999
9.709
+2.259
30.32%
jan 1, 2000
10.241
+0.532
5.48%
jan 1, 2001
10.739
+0.498
4.86%
jan 1, 2002
10.992
+0.253
2.35%
jan 1, 2003
10.941
-0.051
-0.46%
jan 1, 2004
10.841
-0.1
-0.92%
jan 1, 2005
10.807
-0.034
-0.31%
jan 1, 2006
11.163
+0.356
3.29%
jan 1, 2007
10.691
-0.472
-4.23%
jan 1, 2008
10.255
-0.436
-4.07%
jan 1, 2009
10.957
+0.702
6.85%
jan 1, 2010
9.398
-1.559
-14.23%
jan 1, 2011
9.575
+0.177
1.89%
jan 1, 2012
8.869
-0.706
-7.38%
jan 1, 2013
8.494
-0.376
-4.24%
jan 1, 2014
9.251
+0.758
8.92%
jan 1, 2015
9.274
+0.023
0.25%
Ranking of countries by current statistics by years


Comments: