29
/
en
AIzaSyAYiBZKx7MnpbEhh9jyipgxe19OcubqV5w
April 1, 2024
215753
Oman
OMN
true
2
1
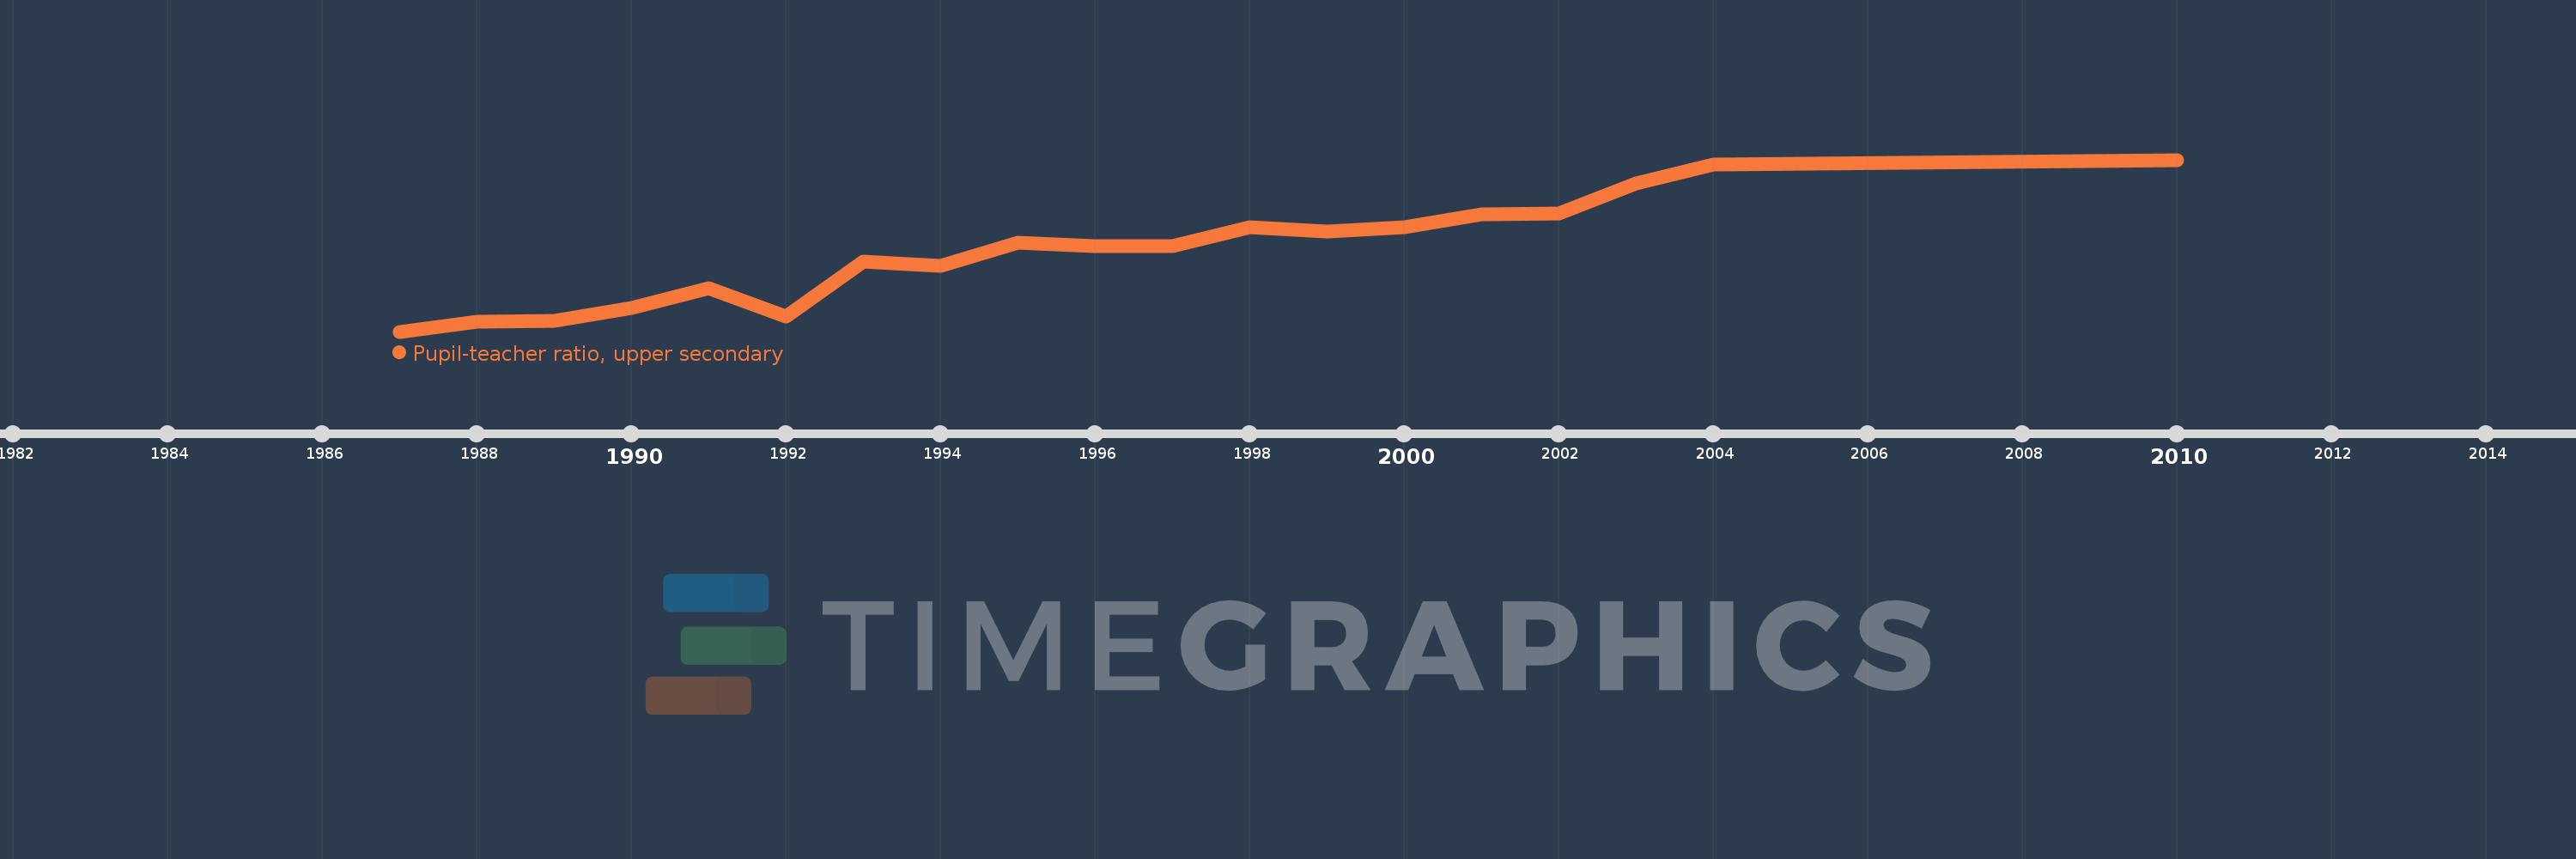
Pupil-teacher ratio, upper secondary
2010,2004,2003,2002,2001,2000,1999,1998,1997,1996,1995,1994,1993,1992,1991,1990,1989,1988,1987
This statistics in other country:
Timeline:
This timeline shows a graph from 1987 to 2010 of Oman. No data until 1986. Number of actual observations by date: 19.
Source name:
World Development Indicators
Source organization:
United Nations Educational, Scientific, and Cultural Organization (UNESCO) Institute for Statistics.
Categories, topics:
Education
Last updated:
apr 23, 2017
Indicators value changes by year
Minimum:
10.092
jan 1, 1987
Maximum:
20.178
jan 1, 2010
At the date of observation
Value
Absolute change
Change from previous value
jan 1, 1987
10.092
+10.092
0.0%
jan 1, 1988
10.678
+0.586
5.81%
jan 1, 1989
10.736
+0.058
0.54%
jan 1, 1990
11.491
+0.755
7.04%
jan 1, 1991
12.639
+1.148
9.99%
jan 1, 1992
10.981
-1.657
-13.11%
jan 1, 1993
14.226
+3.245
29.55%
jan 1, 1994
13.955
-0.272
-1.91%
jan 1, 1995
15.295
+1.34
9.6%
jan 1, 1996
15.1
-0.195
-1.28%
jan 1, 1997
15.113
+0.013
0.09%
jan 1, 1998
16.216
+1.103
7.3%
jan 1, 1999
15.956
-0.26
-1.6%
jan 1, 2000
16.217
+0.262
1.64%
jan 1, 2001
16.972
+0.754
4.65%
jan 1, 2002
17.01
+0.038
0.23%
jan 1, 2003
18.794
+1.784
10.49%
jan 1, 2004
19.89
+1.096
5.83%
jan 1, 2010
20.178
+0.288
1.45%
Ranking of countries by current statistics by years


Comments: