29
/
en
AIzaSyAYiBZKx7MnpbEhh9jyipgxe19OcubqV5w
April 1, 2024
168992
Kiribati
KIR
true
2
1
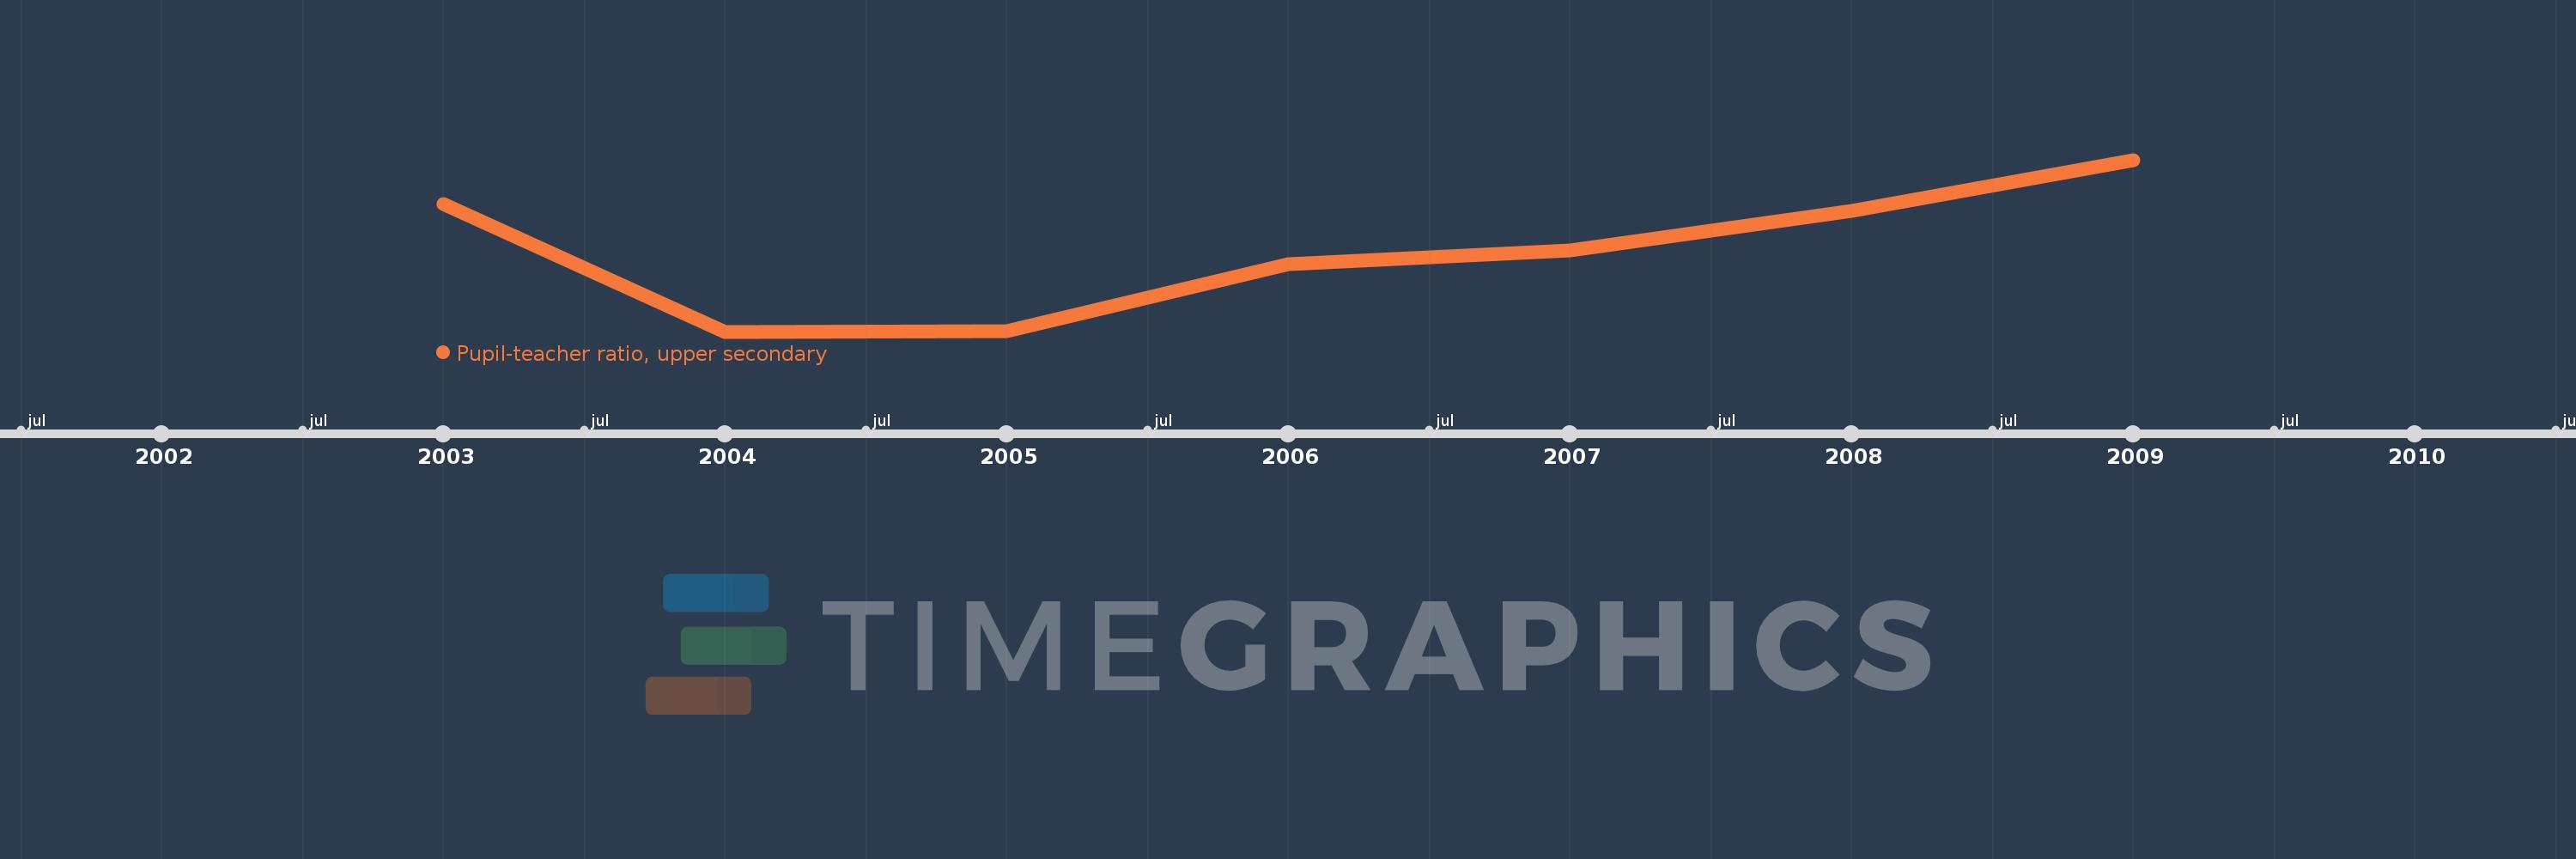
Pupil-teacher ratio, upper secondary
2009,2008,2007,2006,2005,2004,2003
This statistics in other country:
Timeline:
This timeline shows a graph from 2003 to 2009 of Kiribati. No data until 2002. Number of actual observations by date: 7.
Source name:
World Development Indicators
Source organization:
United Nations Educational, Scientific, and Cultural Organization (UNESCO) Institute for Statistics.
Categories, topics:
Education
Last updated:
apr 23, 2017
Indicators value changes by year
Minimum:
14.084
jan 1, 2004
Maximum:
19.008
jan 1, 2009
At the date of observation
Value
Absolute change
Change from previous value
jan 1, 2003
17.729
+17.729
0.0%
jan 1, 2004
14.084
-3.645
-20.56%
jan 1, 2005
14.09
+0.006
0.04%
jan 1, 2006
16.018
+1.927
13.68%
jan 1, 2007
16.406
+0.388
2.42%
jan 1, 2008
17.545
+1.139
6.94%
jan 1, 2009
19.008
+1.463
8.34%
Ranking of countries by current statistics by years


Comments: