29
/
en
AIzaSyAYiBZKx7MnpbEhh9jyipgxe19OcubqV5w
April 1, 2024
270004
Turkey
TUR
true
2
1
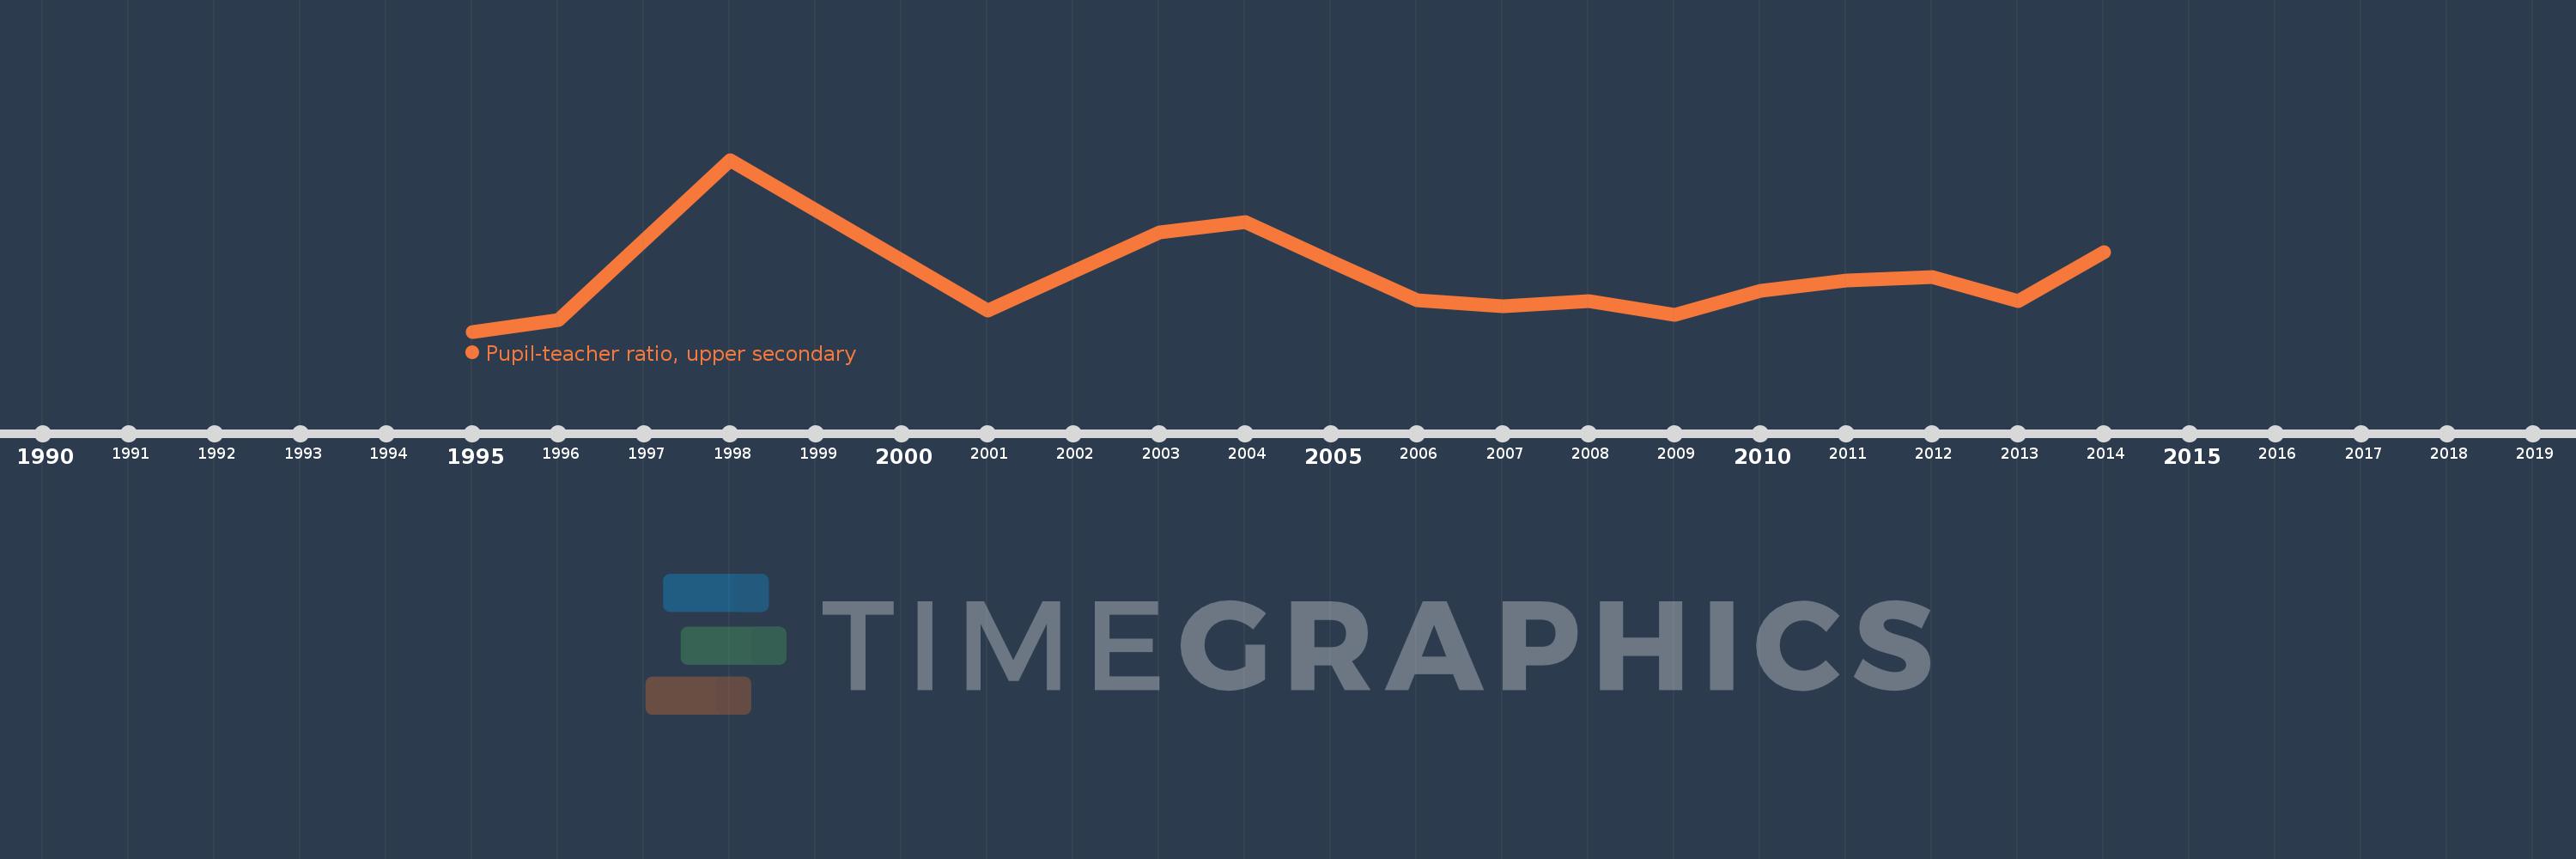
Pupil-teacher ratio, upper secondary
2014,2013,2012,2011,2010,2009,2008,2007,2006,2005,2004,2003,2001,1998,1996,1995
This statistics in other country:
Timeline:
This timeline shows a graph from 1995 to 2014 of Turkey. No data until 1994. Number of actual observations by date: 16.
Source name:
World Development Indicators
Source organization:
United Nations Educational, Scientific, and Cultural Organization (UNESCO) Institute for Statistics.
Categories, topics:
Education
Last updated:
apr 23, 2017
Indicators value changes by year
Minimum:
14.078
jan 1, 1995
Maximum:
25.971
jan 1, 1998
At the date of observation
Value
Absolute change
Change from previous value
jan 1, 1995
14.078
+14.078
0.0%
jan 1, 1996
14.888
+0.81
5.75%
jan 1, 1998
25.971
+11.083
74.44%
jan 1, 2001
15.556
-10.415
-40.1%
jan 1, 2003
20.952
+5.396
34.69%
jan 1, 2004
21.681
+0.729
3.48%
jan 1, 2005
18.949
-2.732
-12.6%
jan 1, 2006
16.223
-2.726
-14.39%
jan 1, 2007
15.808
-0.416
-2.56%
jan 1, 2008
16.161
+0.353
2.23%
jan 1, 2009
15.238
-0.922
-5.71%
jan 1, 2010
16.924
+1.685
11.06%
jan 1, 2011
17.592
+0.668
3.95%
jan 1, 2012
17.828
+0.236
1.34%
jan 1, 2013
16.182
-1.646
-9.23%
jan 1, 2014
19.599
+3.416
21.11%
Ranking of countries by current statistics by years


Comments: