29
/
en
AIzaSyAYiBZKx7MnpbEhh9jyipgxe19OcubqV5w
April 1, 2024
28654
East Asia & Pacific (excluding high income)
EAP
false
2
1
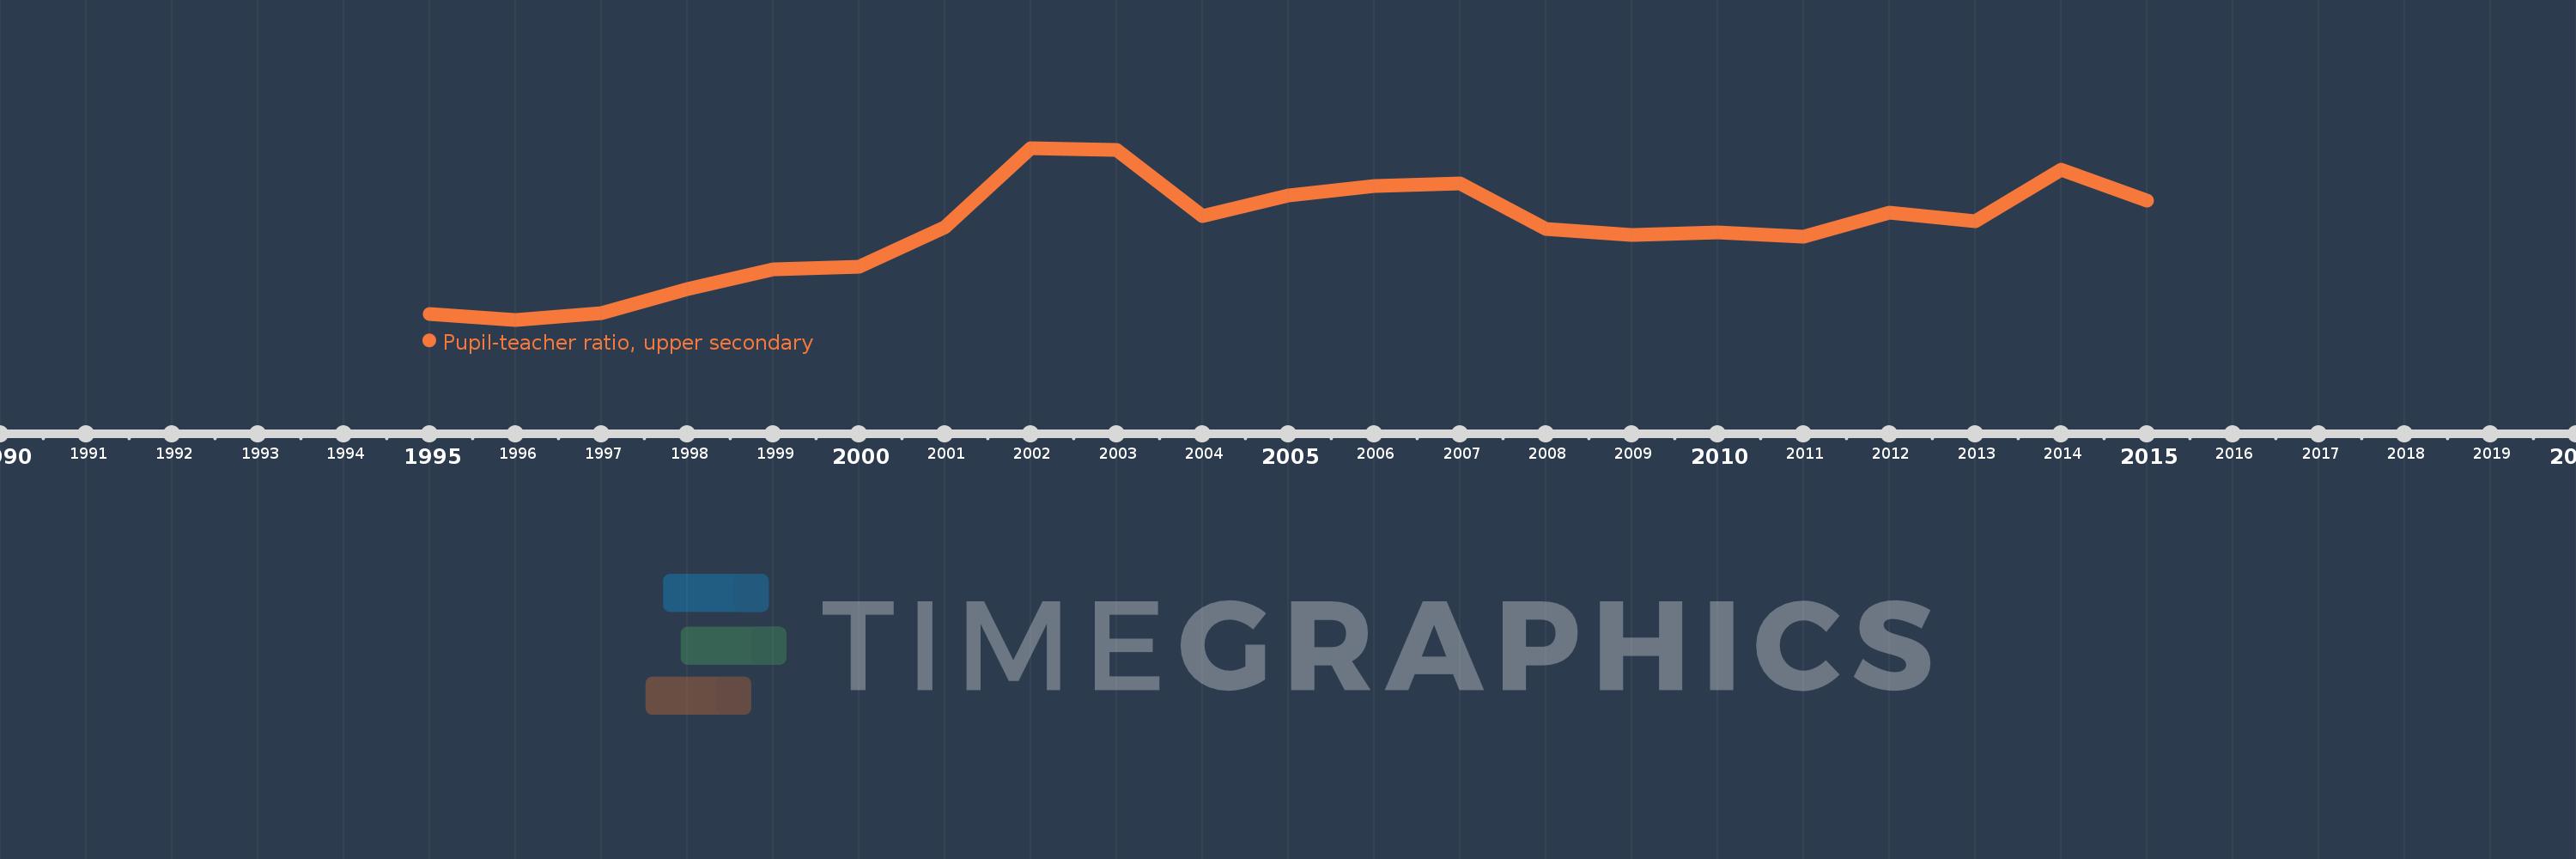
Pupil-teacher ratio, upper secondary
2015,2014,2013,2012,2011,2010,2009,2008,2007,2006,2005,2004,2003,2002,2001,2000,1999,1998,1997,1996,1995
This statistics in other country:
Timeline:
This timeline shows a graph from 1995 to 2015 of East Asia & Pacific (excluding high income). No data until 1994. Number of actual observations by date: 21.
Source name:
World Development Indicators
Source organization:
United Nations Educational, Scientific, and Cultural Organization (UNESCO) Institute for Statistics.
Categories, topics:
Education
Last updated:
apr 23, 2017
Indicators value changes by year
Minimum:
13.626
jan 1, 1996
Maximum:
18.905
jan 1, 2002
At the date of observation
Value
Absolute change
Change from previous value
jan 1, 1995
13.807
+13.807
0.0%
jan 1, 1996
13.626
-0.181
-1.31%
jan 1, 1997
13.828
+0.202
1.48%
jan 1, 1998
14.567
+0.739
5.35%
jan 1, 1999
15.187
+0.62
4.25%
jan 1, 2000
15.251
+0.064
0.42%
jan 1, 2001
16.479
+1.228
8.05%
jan 1, 2002
18.905
+2.426
14.72%
jan 1, 2003
18.833
-0.072
-0.38%
jan 1, 2004
16.817
-2.017
-10.71%
jan 1, 2005
17.448
+0.631
3.75%
jan 1, 2006
17.736
+0.289
1.65%
jan 1, 2007
17.806
+0.07
0.39%
jan 1, 2008
16.418
-1.388
-7.79%
jan 1, 2009
16.226
-0.192
-1.17%
jan 1, 2010
16.3
+0.073
0.45%
jan 1, 2011
16.189
-0.111
-0.68%
jan 1, 2012
16.92
+0.732
4.52%
jan 1, 2013
16.663
-0.257
-1.52%
jan 1, 2014
18.225
+1.561
9.37%
jan 1, 2015
17.279
-0.946
-5.19%
Ranking of countries by current statistics by years


Comments: