29
/
en
AIzaSyAYiBZKx7MnpbEhh9jyipgxe19OcubqV5w
April 1, 2024
56582
Small states
SST
false
2
1
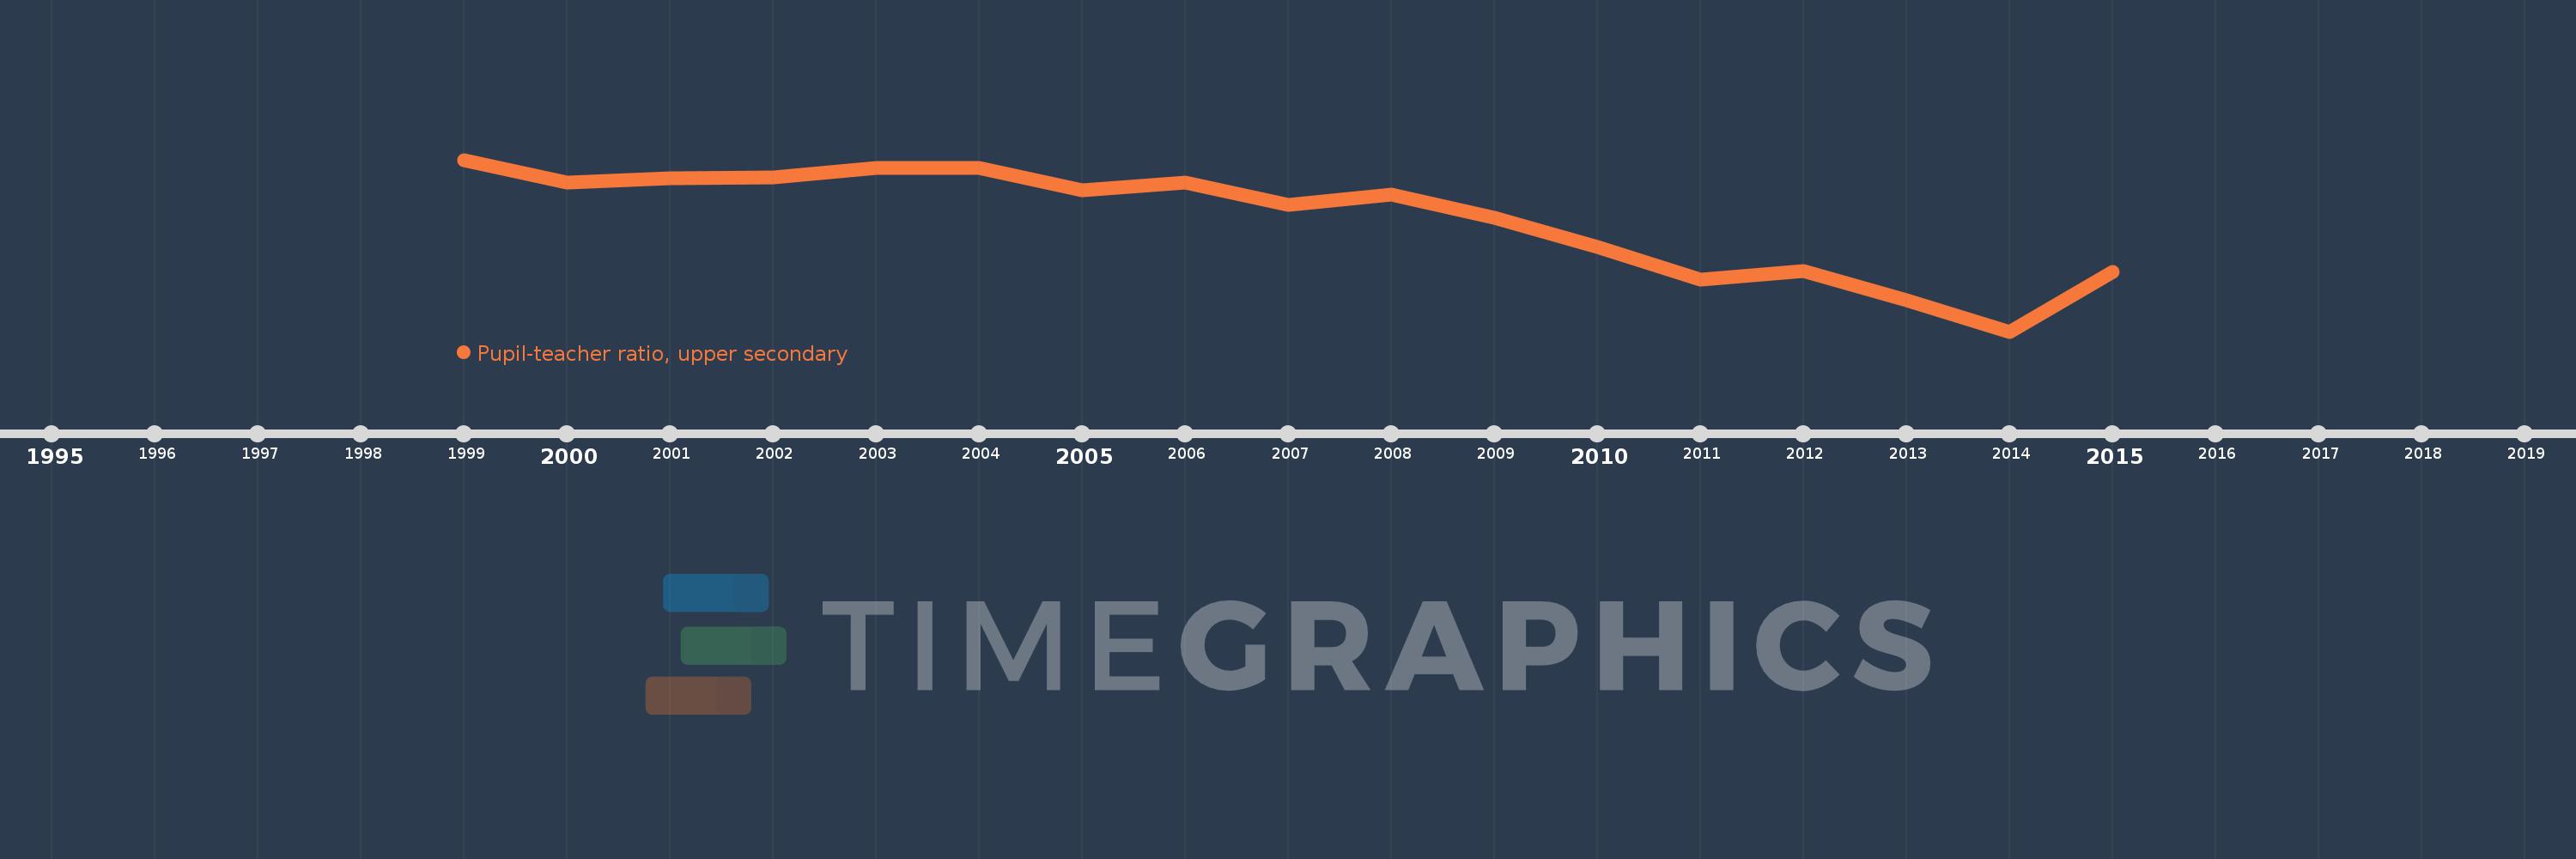
Pupil-teacher ratio, upper secondary
2015,2014,2013,2012,2011,2010,2009,2008,2007,2006,2005,2004,2003,2002,2001,2000,1999
This statistics in other country:
Timeline:
This timeline shows a graph from 1999 to 2015 of Small states. No data until 1998. Number of actual observations by date: 17.
Source name:
World Development Indicators
Source organization:
United Nations Educational, Scientific, and Cultural Organization (UNESCO) Institute for Statistics.
Categories, topics:
Education
Last updated:
apr 23, 2017
Indicators value changes by year
Minimum:
12.201
jan 1, 2014
Maximum:
14.753
jan 1, 1999
At the date of observation
Value
Absolute change
Change from previous value
jan 1, 1999
14.753
+14.753
0.0%
jan 1, 2000
14.411
-0.341
-2.31%
jan 1, 2001
14.48
+0.069
0.48%
jan 1, 2002
14.488
+0.008
0.05%
jan 1, 2003
14.638
+0.15
1.03%
jan 1, 2004
14.637
-0.001
0.0%
jan 1, 2005
14.295
-0.342
-2.34%
jan 1, 2006
14.414
+0.119
0.84%
jan 1, 2007
14.086
-0.328
-2.28%
jan 1, 2008
14.235
+0.149
1.06%
jan 1, 2009
13.889
-0.346
-2.43%
jan 1, 2010
13.457
-0.432
-3.11%
jan 1, 2011
12.973
-0.484
-3.6%
jan 1, 2012
13.103
+0.13
1.0%
jan 1, 2013
12.667
-0.436
-3.33%
jan 1, 2014
12.201
-0.466
-3.68%
jan 1, 2015
13.086
+0.885
7.25%
Ranking of countries by current statistics by years


Comments: