29
/
en
AIzaSyAYiBZKx7MnpbEhh9jyipgxe19OcubqV5w
April 1, 2024
106590
China
CHN
true
2
1
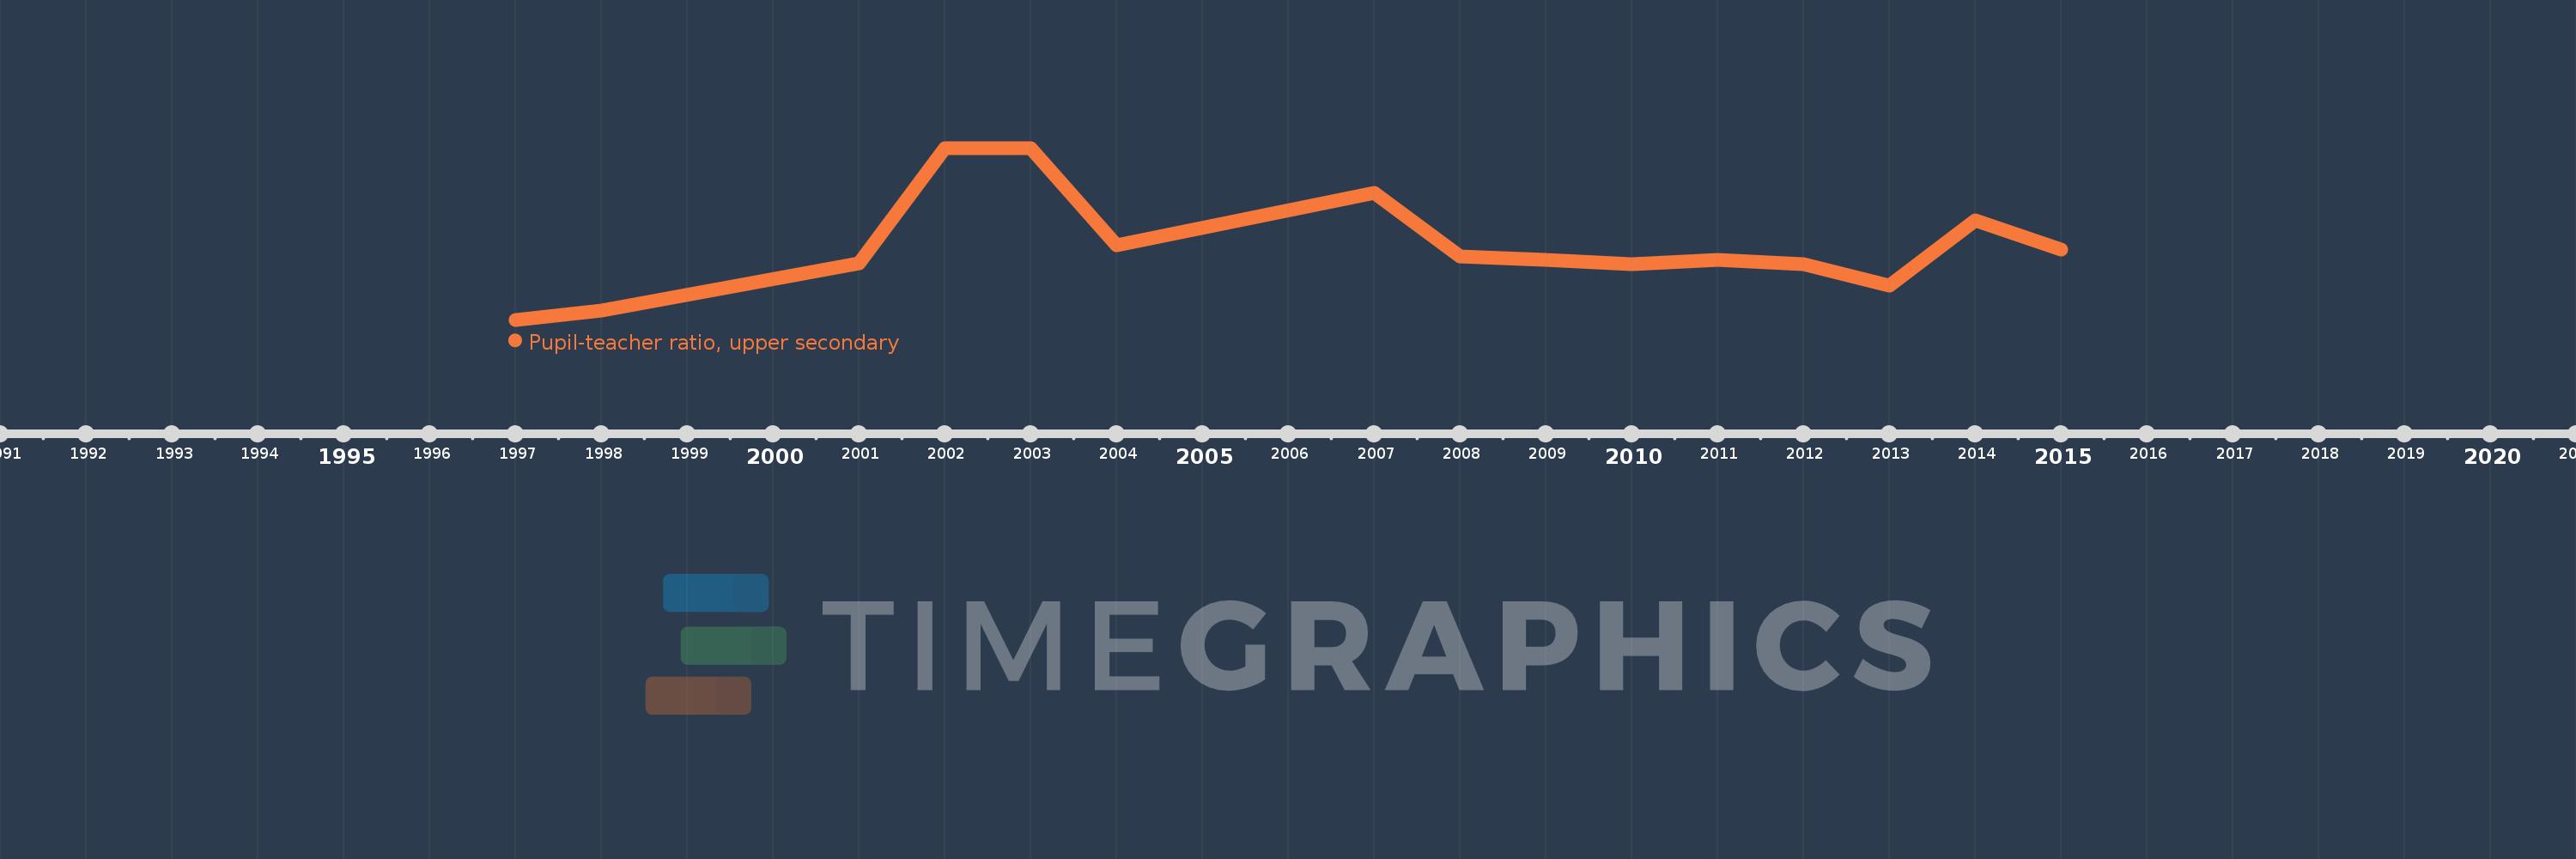
Pupil-teacher ratio, upper secondary
2015,2014,2013,2012,2011,2010,2009,2008,2007,2004,2003,2002,2001,1998,1997
This statistics in other country:
Timeline:
This timeline shows a graph from 1997 to 2015 of China. No data until 1996. Number of actual observations by date: 15.
Source name:
World Development Indicators
Source organization:
United Nations Educational, Scientific, and Cultural Organization (UNESCO) Institute for Statistics.
Categories, topics:
Education
Last updated:
apr 23, 2017
Indicators value changes by year
Minimum:
14.208
jan 1, 1997
Maximum:
19.902
jan 1, 2002
At the date of observation
Value
Absolute change
Change from previous value
jan 1, 1997
14.208
+14.208
0.0%
jan 1, 1998
14.521
+0.314
2.21%
jan 1, 2001
16.065
+1.543
10.63%
jan 1, 2002
19.902
+3.837
23.89%
jan 1, 2003
19.902
0.0
0.0%
jan 1, 2004
16.672
-3.23
-16.23%
jan 1, 2007
18.412
+1.739
10.43%
jan 1, 2008
16.319
-2.093
-11.37%
jan 1, 2009
16.198
-0.121
-0.74%
jan 1, 2010
16.059
-0.139
-0.86%
jan 1, 2011
16.197
+0.138
0.86%
jan 1, 2012
16.053
-0.145
-0.89%
jan 1, 2013
15.338
-0.715
-4.45%
jan 1, 2014
17.5
+2.162
14.1%
jan 1, 2015
16.526
-0.975
-5.57%
Ranking of countries by current statistics by years


Comments: