29
/
en
AIzaSyAYiBZKx7MnpbEhh9jyipgxe19OcubqV5w
April 1, 2024
278202
Uruguay
URY
true
2
1
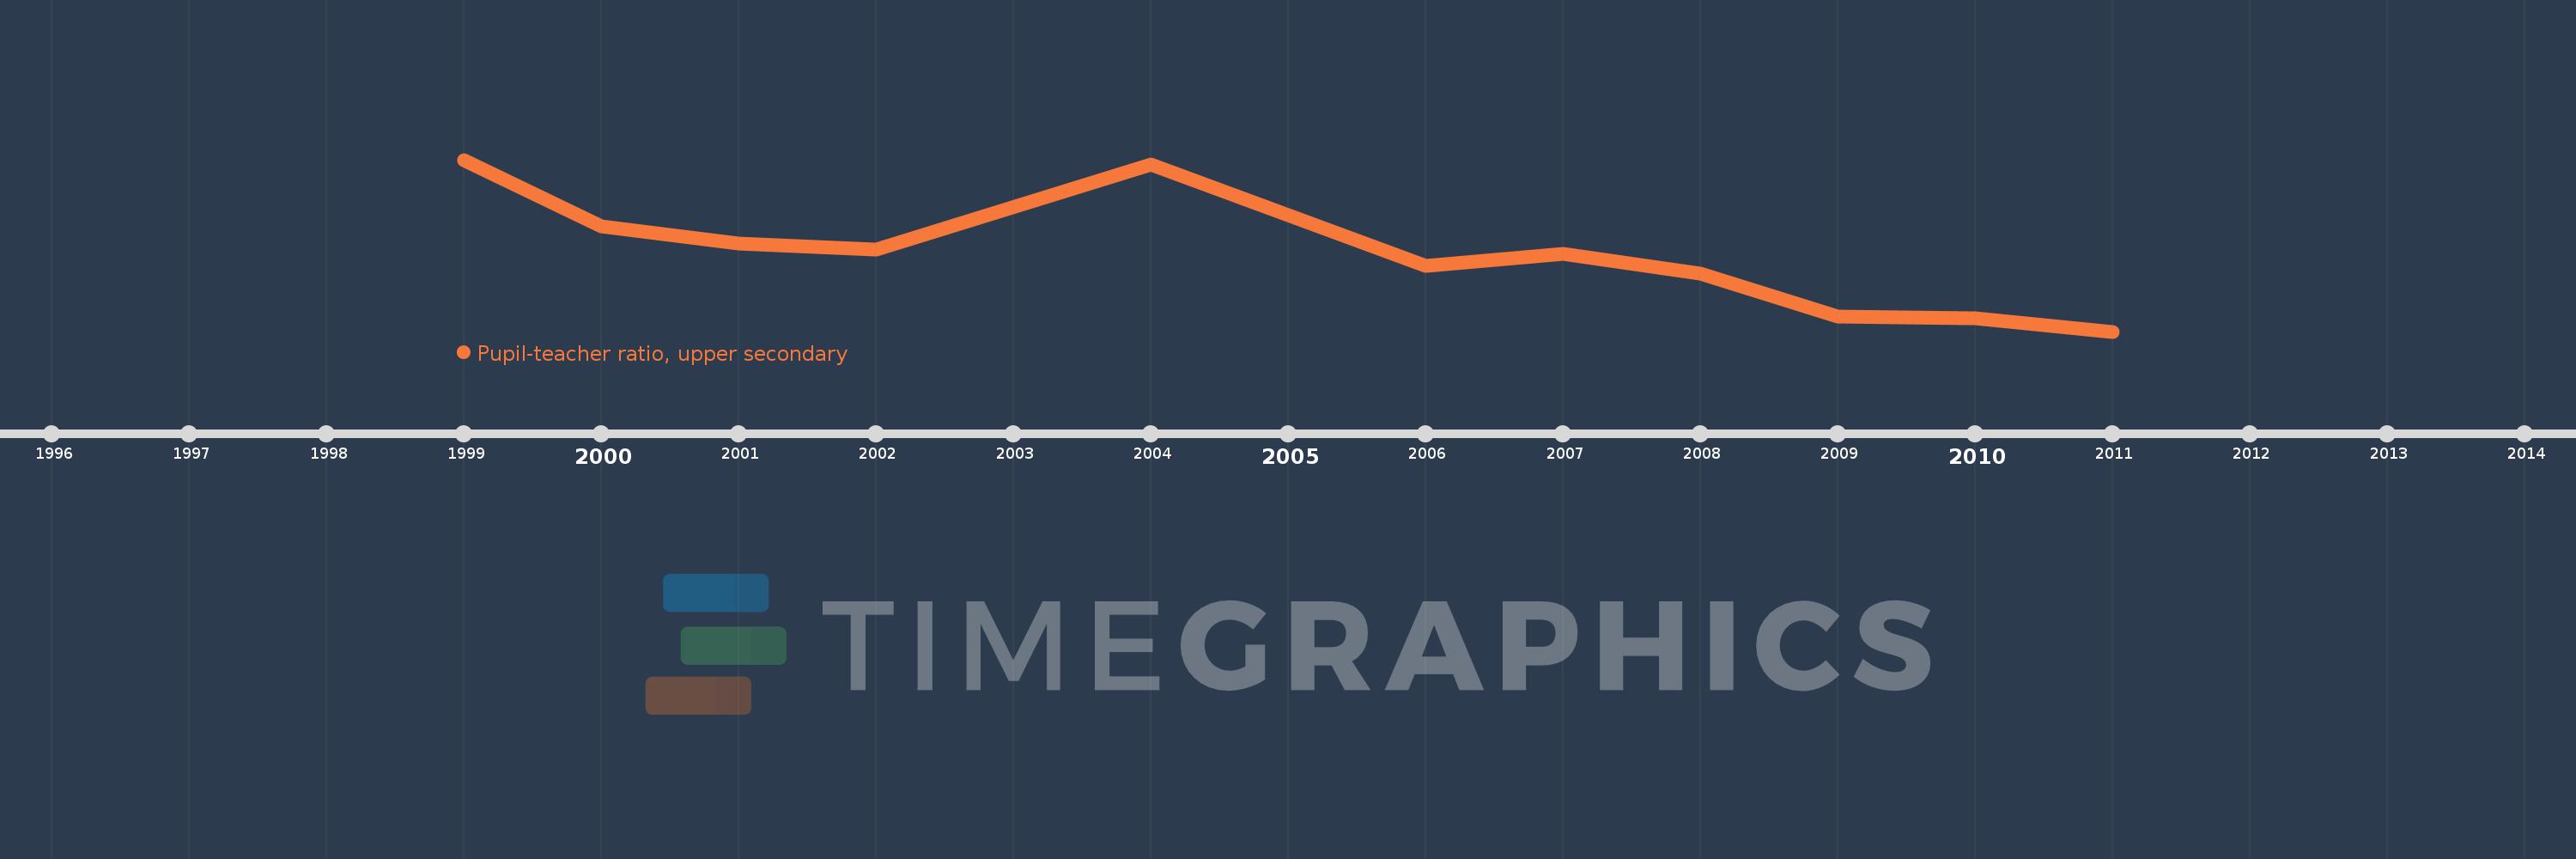
Pupil-teacher ratio, upper secondary
2011,2010,2009,2008,2007,2006,2004,2002,2001,2000,1999
This statistics in other country:
Timeline:
This timeline shows a graph from 1999 to 2011 of Uruguay. No data until 1998. Number of actual observations by date: 11.
Source name:
World Development Indicators
Source organization:
United Nations Educational, Scientific, and Cultural Organization (UNESCO) Institute for Statistics.
Categories, topics:
Education
Last updated:
apr 23, 2017
Indicators value changes by year
Minimum:
13.784
jan 1, 2011
Maximum:
28.104
jan 1, 1999
At the date of observation
Value
Absolute change
Change from previous value
jan 1, 1999
28.104
+28.104
0.0%
jan 1, 2000
22.563
-5.541
-19.72%
jan 1, 2001
21.119
-1.444
-6.4%
jan 1, 2002
20.61
-0.509
-2.41%
jan 1, 2004
27.713
+7.103
34.47%
jan 1, 2006
19.25
-8.463
-30.54%
jan 1, 2007
20.269
+1.019
5.29%
jan 1, 2008
18.641
-1.627
-8.03%
jan 1, 2009
15.049
-3.593
-19.27%
jan 1, 2010
14.914
-0.135
-0.89%
jan 1, 2011
13.784
-1.13
-7.58%
Ranking of countries by current statistics by years


Comments: