29
/
en
AIzaSyAYiBZKx7MnpbEhh9jyipgxe19OcubqV5w
April 1, 2024
193627
Mauritania
MRT
true
2
1
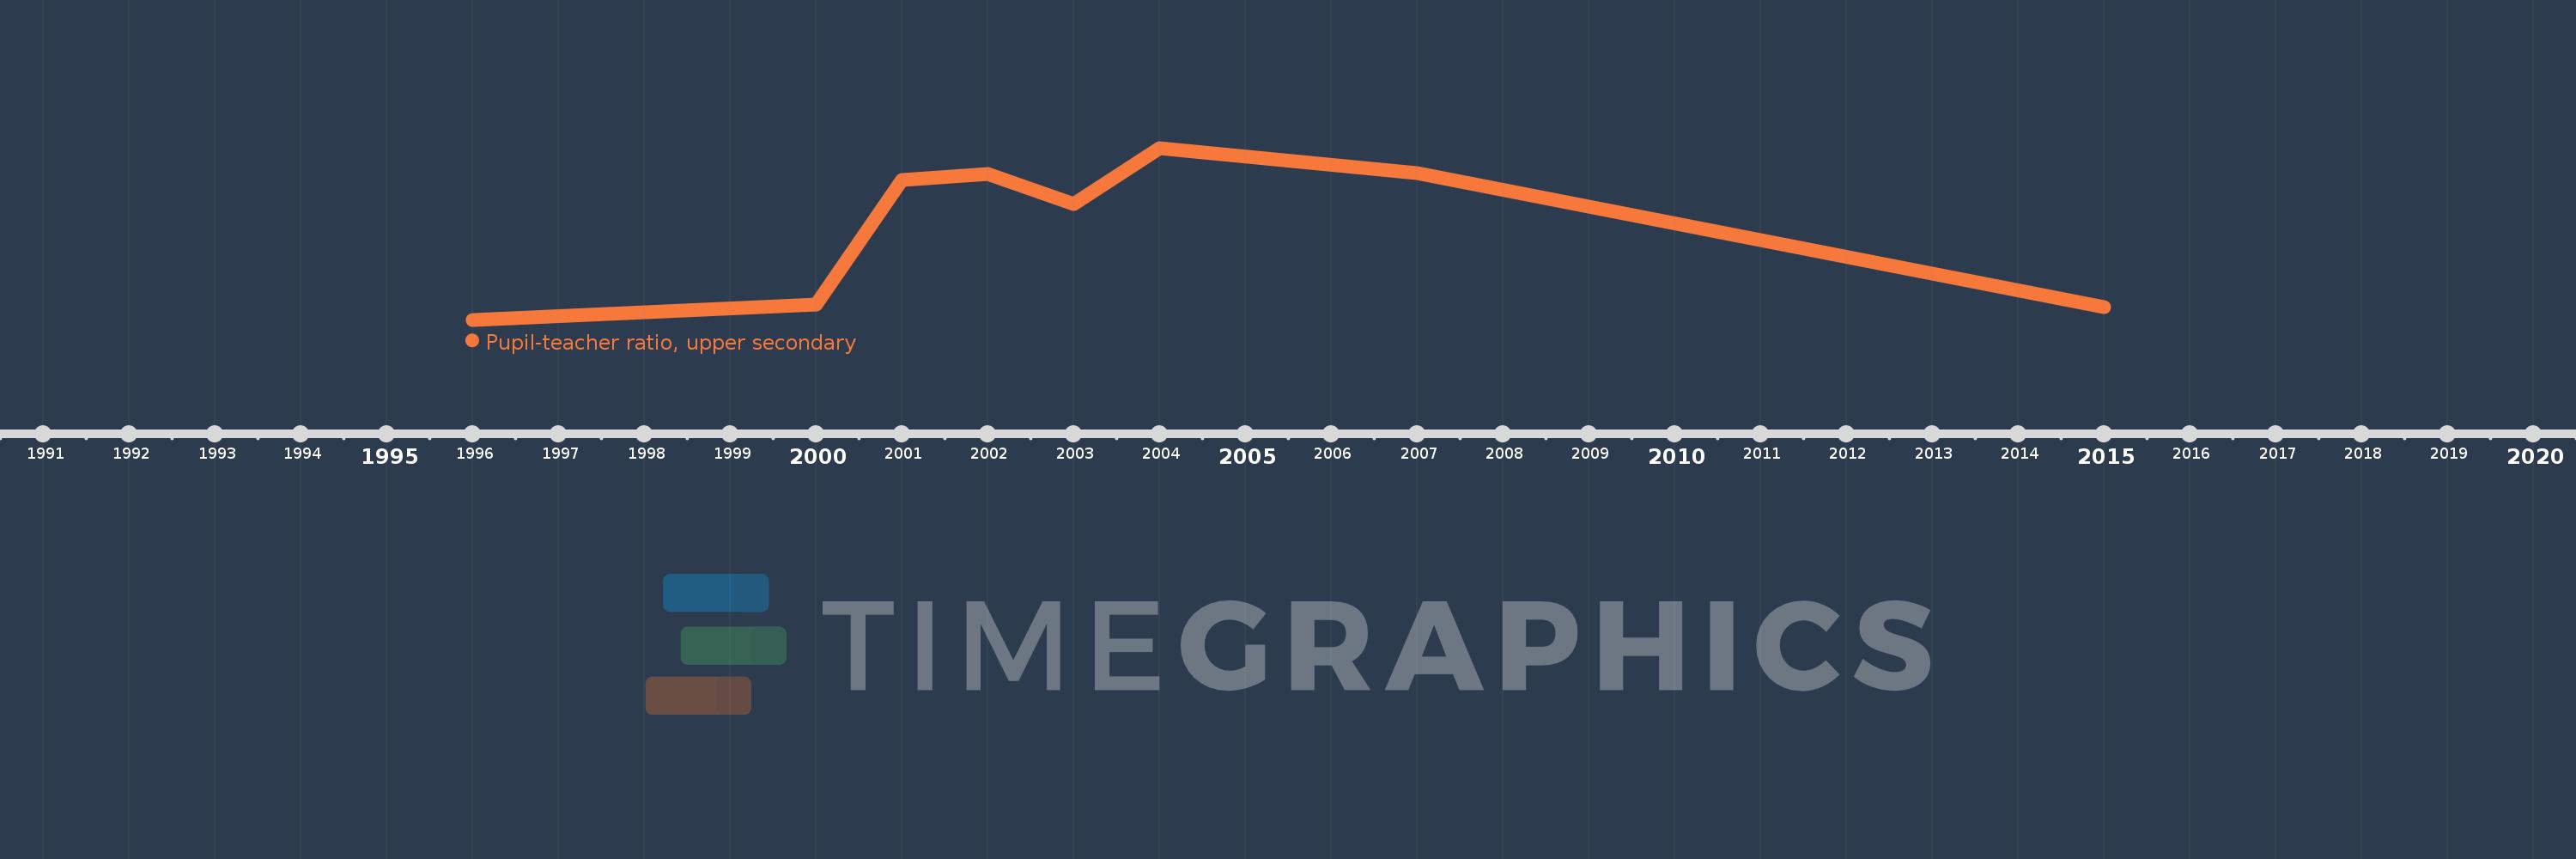
Pupil-teacher ratio, upper secondary
2015,2007,2004,2003,2002,2001,2000,1996
This statistics in other country:
Timeline:
This timeline shows a graph from 1996 to 2015 of Mauritania. No data until 1995. Number of actual observations by date: 8.
Source name:
World Development Indicators
Source organization:
United Nations Educational, Scientific, and Cultural Organization (UNESCO) Institute for Statistics.
Categories, topics:
Education
Last updated:
apr 23, 2017
Indicators value changes by year
Minimum:
16.593
jan 1, 1996
Maximum:
25.725
jan 1, 2004
At the date of observation
Value
Absolute change
Change from previous value
jan 1, 1996
16.593
+16.593
0.0%
jan 1, 2000
17.383
+0.791
4.77%
jan 1, 2001
24.04
+6.657
38.3%
jan 1, 2002
24.325
+0.284
1.18%
jan 1, 2003
22.734
-1.591
-6.54%
jan 1, 2004
25.725
+2.991
13.16%
jan 1, 2007
24.382
-1.343
-5.22%
jan 1, 2015
17.278
-7.104
-29.14%
Ranking of countries by current statistics by years


Comments: