29
/
en
AIzaSyAYiBZKx7MnpbEhh9jyipgxe19OcubqV5w
April 1, 2024
277069
United States
USA
true
2
1
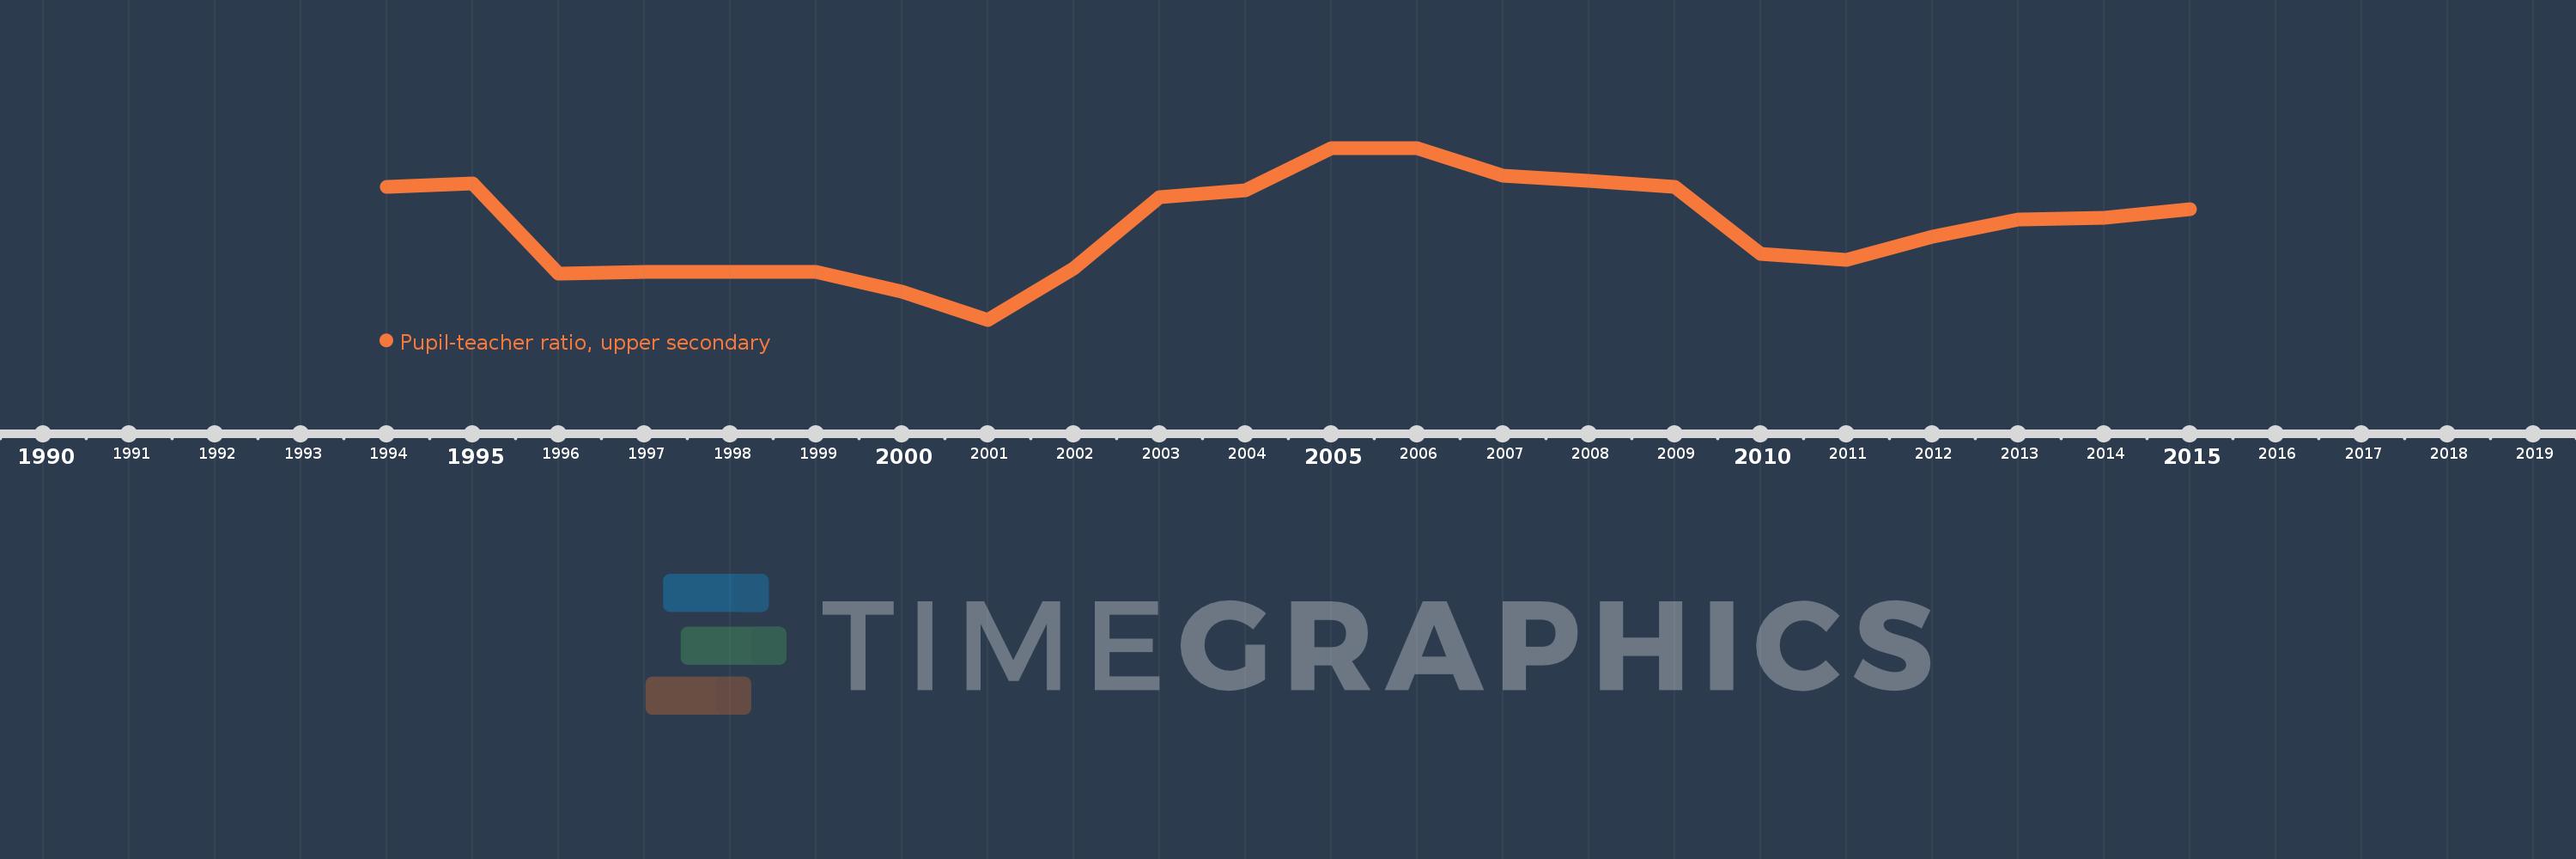
Pupil-teacher ratio, upper secondary
2015,2014,2013,2012,2011,2010,2009,2008,2007,2006,2005,2004,2003,2002,2001,2000,1999,1997,1996,1995,1994
This statistics in other country:
Timeline:
This timeline shows a graph from 1994 to 2015 of United States. No data until 1993. Number of actual observations by date: 21.
Source name:
World Development Indicators
Source organization:
United Nations Educational, Scientific, and Cultural Organization (UNESCO) Institute for Statistics.
Categories, topics:
Education
Last updated:
apr 23, 2017
Indicators value changes by year
Minimum:
13.478
jan 1, 2001
Maximum:
15.494
jan 1, 2006
At the date of observation
Value
Absolute change
Change from previous value
jan 1, 1994
15.038
+15.038
0.0%
jan 1, 1995
15.079
+0.04
0.27%
jan 1, 1996
14.024
-1.055
-6.99%
jan 1, 1997
14.039
+0.015
0.11%
jan 1, 1999
14.04
+0.001
0.01%
jan 1, 2000
13.811
-0.229
-1.63%
jan 1, 2001
13.478
-0.333
-2.41%
jan 1, 2002
14.076
+0.598
4.44%
jan 1, 2003
14.915
+0.839
5.96%
jan 1, 2004
15.0
+0.085
0.57%
jan 1, 2005
15.493
+0.492
3.28%
jan 1, 2006
15.494
+0.001
0.01%
jan 1, 2007
15.171
-0.323
-2.09%
jan 1, 2008
15.109
-0.061
-0.4%
jan 1, 2009
15.036
-0.074
-0.49%
jan 1, 2010
14.251
-0.784
-5.22%
jan 1, 2011
14.184
-0.067
-0.47%
jan 1, 2012
14.456
+0.272
1.92%
jan 1, 2013
14.653
+0.197
1.36%
jan 1, 2014
14.679
+0.026
0.18%
jan 1, 2015
14.774
+0.095
0.65%
Ranking of countries by current statistics by years


Comments: