29
/
en
AIzaSyAYiBZKx7MnpbEhh9jyipgxe19OcubqV5w
April 1, 2024
226341
Portugal
PRT
true
2
1
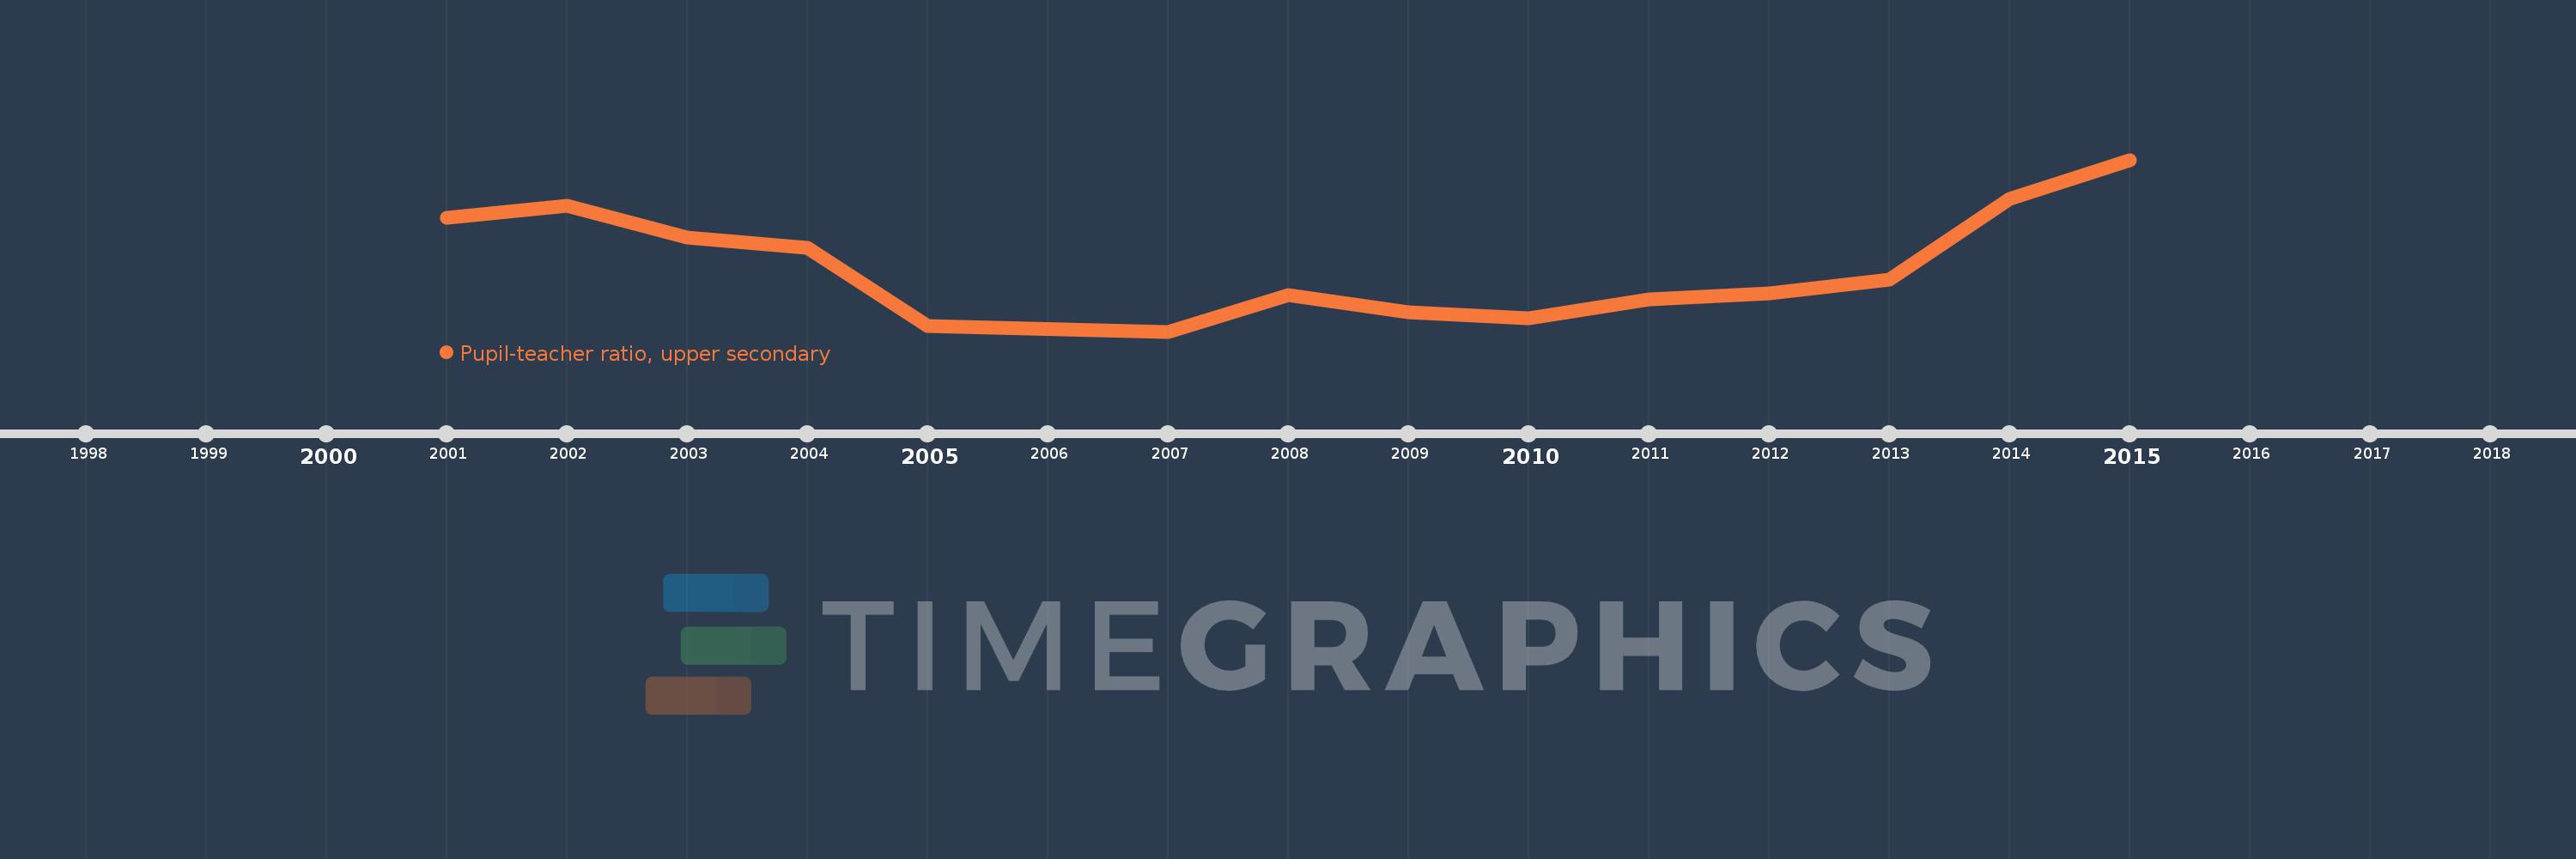
Pupil-teacher ratio, upper secondary
2015,2014,2013,2012,2011,2010,2009,2008,2007,2005,2004,2003,2002,2001
This statistics in other country:
Timeline:
This timeline shows a graph from 2001 to 2015 of Portugal. No data until 2000. Number of actual observations by date: 14.
Source name:
World Development Indicators
Source organization:
United Nations Educational, Scientific, and Cultural Organization (UNESCO) Institute for Statistics.
Categories, topics:
Education
Last updated:
apr 23, 2017
Indicators value changes by year
At the date of observation
Value
Absolute change
Change from previous value
jan 1, 2001
8.739
+8.739
0.0%
jan 1, 2002
9.024
+0.285
3.26%
jan 1, 2003
8.282
-0.742
-8.22%
jan 1, 2004
8.051
-0.232
-2.8%
jan 1, 2005
6.198
-1.852
-23.01%
jan 1, 2007
6.073
-0.126
-2.03%
jan 1, 2008
6.927
+0.855
14.08%
jan 1, 2009
6.523
-0.404
-5.84%
jan 1, 2010
6.389
-0.134
-2.06%
jan 1, 2011
6.835
+0.446
6.98%
jan 1, 2012
6.977
+0.142
2.08%
jan 1, 2013
7.302
+0.325
4.66%
jan 1, 2014
9.187
+1.885
25.81%
jan 1, 2015
10.11
+0.924
10.06%
Ranking of countries by current statistics by years


Comments: