29
/
en
AIzaSyAYiBZKx7MnpbEhh9jyipgxe19OcubqV5w
April 1, 2024
128828
Eritrea
ERI
true
2
1
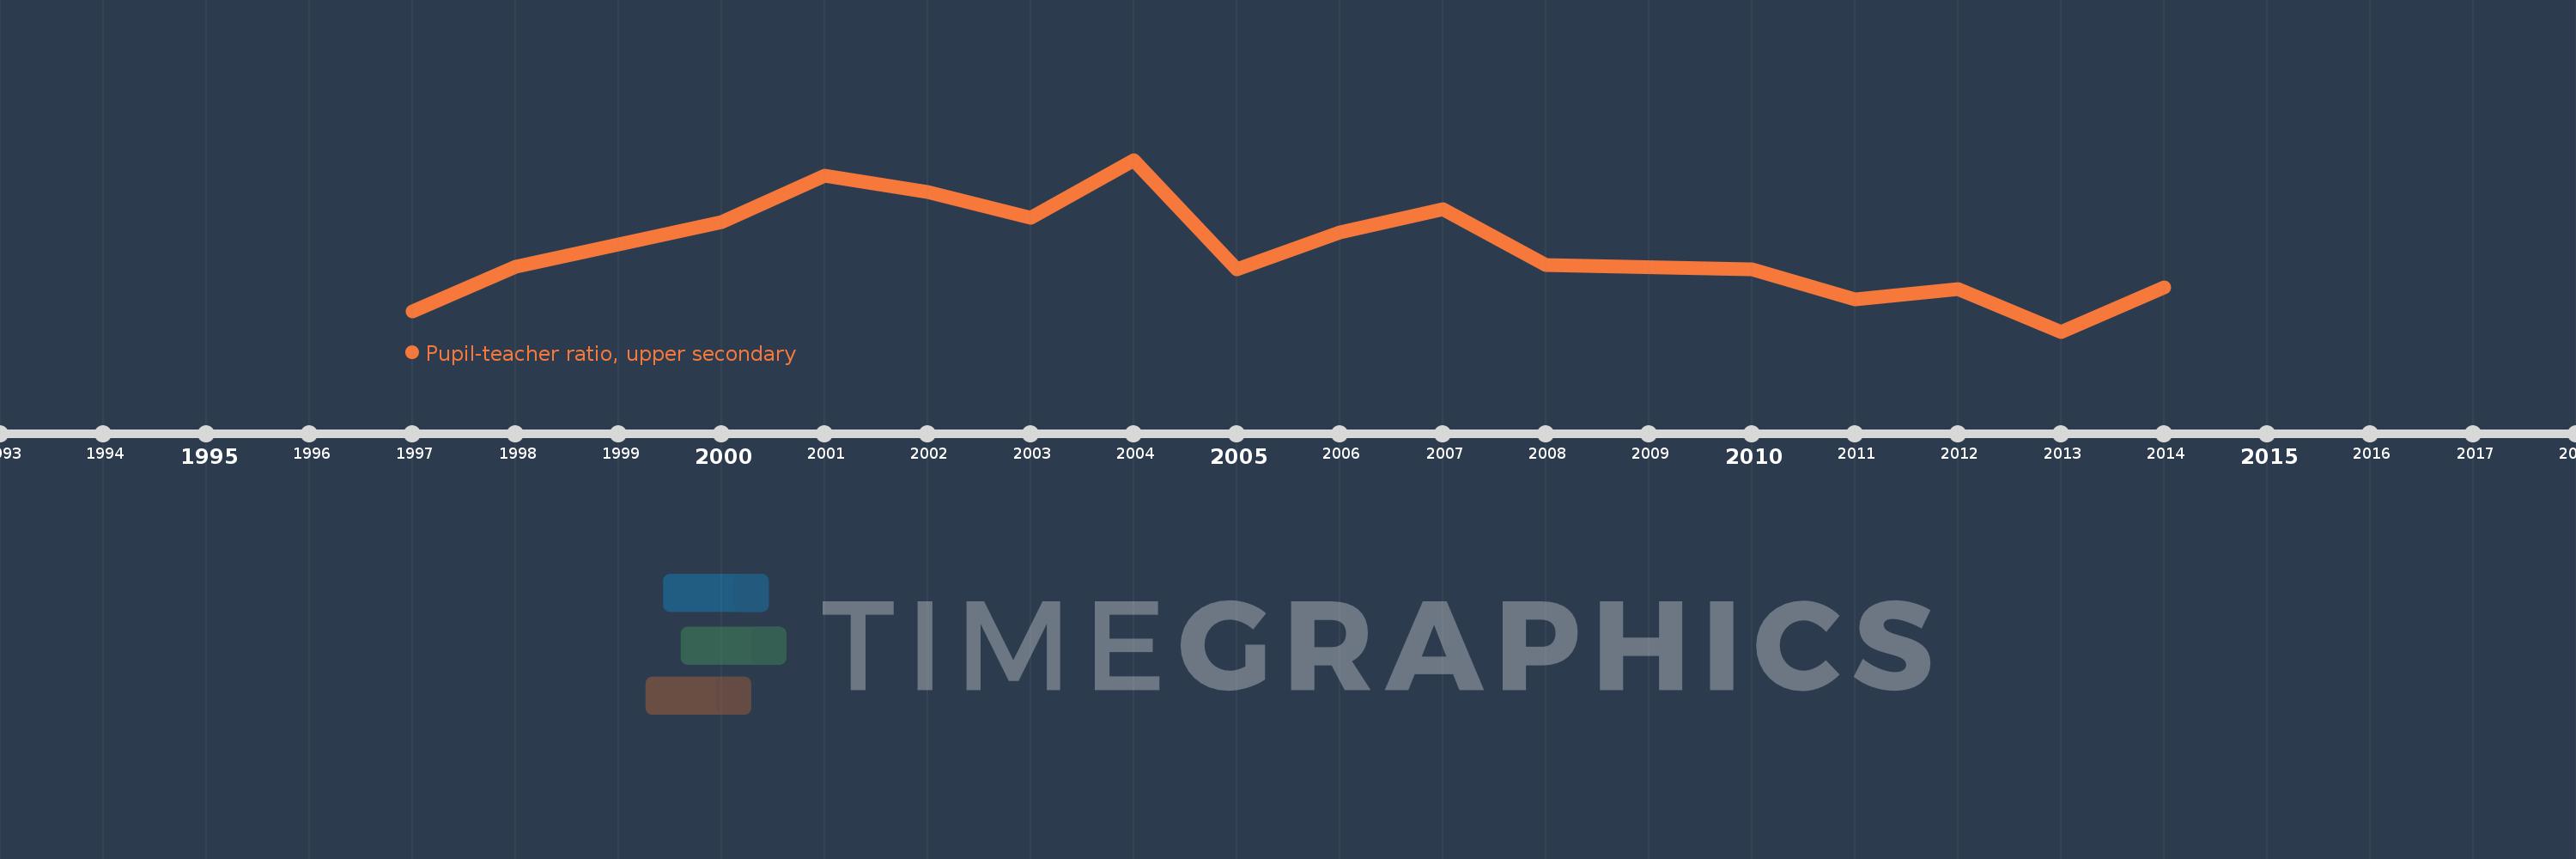
Pupil-teacher ratio, upper secondary
2014,2013,2012,2011,2010,2008,2007,2006,2005,2004,2003,2002,2001,2000,1998,1997
This statistics in other country:
Timeline:
This timeline shows a graph from 1997 to 2014 of Eritrea. No data until 1996. Number of actual observations by date: 16.
Source name:
World Development Indicators
Source organization:
United Nations Educational, Scientific, and Cultural Organization (UNESCO) Institute for Statistics.
Categories, topics:
Education
Last updated:
apr 23, 2017
Indicators value changes by year
Minimum:
31.076
jan 1, 2013
Maximum:
53.306
jan 1, 2004
At the date of observation
Value
Absolute change
Change from previous value
jan 1, 1997
33.664
+33.664
0.0%
jan 1, 1998
39.494
+5.83
17.32%
jan 1, 2000
45.207
+5.713
14.47%
jan 1, 2001
51.213
+6.005
13.28%
jan 1, 2002
49.182
-2.03
-3.96%
jan 1, 2003
45.817
-3.365
-6.84%
jan 1, 2004
53.306
+7.489
16.35%
jan 1, 2005
39.162
-14.144
-26.53%
jan 1, 2006
43.871
+4.709
12.02%
jan 1, 2007
46.968
+3.097
7.06%
jan 1, 2008
39.696
-7.272
-15.48%
jan 1, 2010
39.163
-0.533
-1.34%
jan 1, 2011
35.265
-3.897
-9.95%
jan 1, 2012
36.58
+1.315
3.73%
jan 1, 2013
31.076
-5.504
-15.05%
jan 1, 2014
36.771
+5.695
18.33%
Ranking of countries by current statistics by years


Comments: