29
/
en
AIzaSyAYiBZKx7MnpbEhh9jyipgxe19OcubqV5w
April 1, 2024
62990
World
WLD
false
2
1
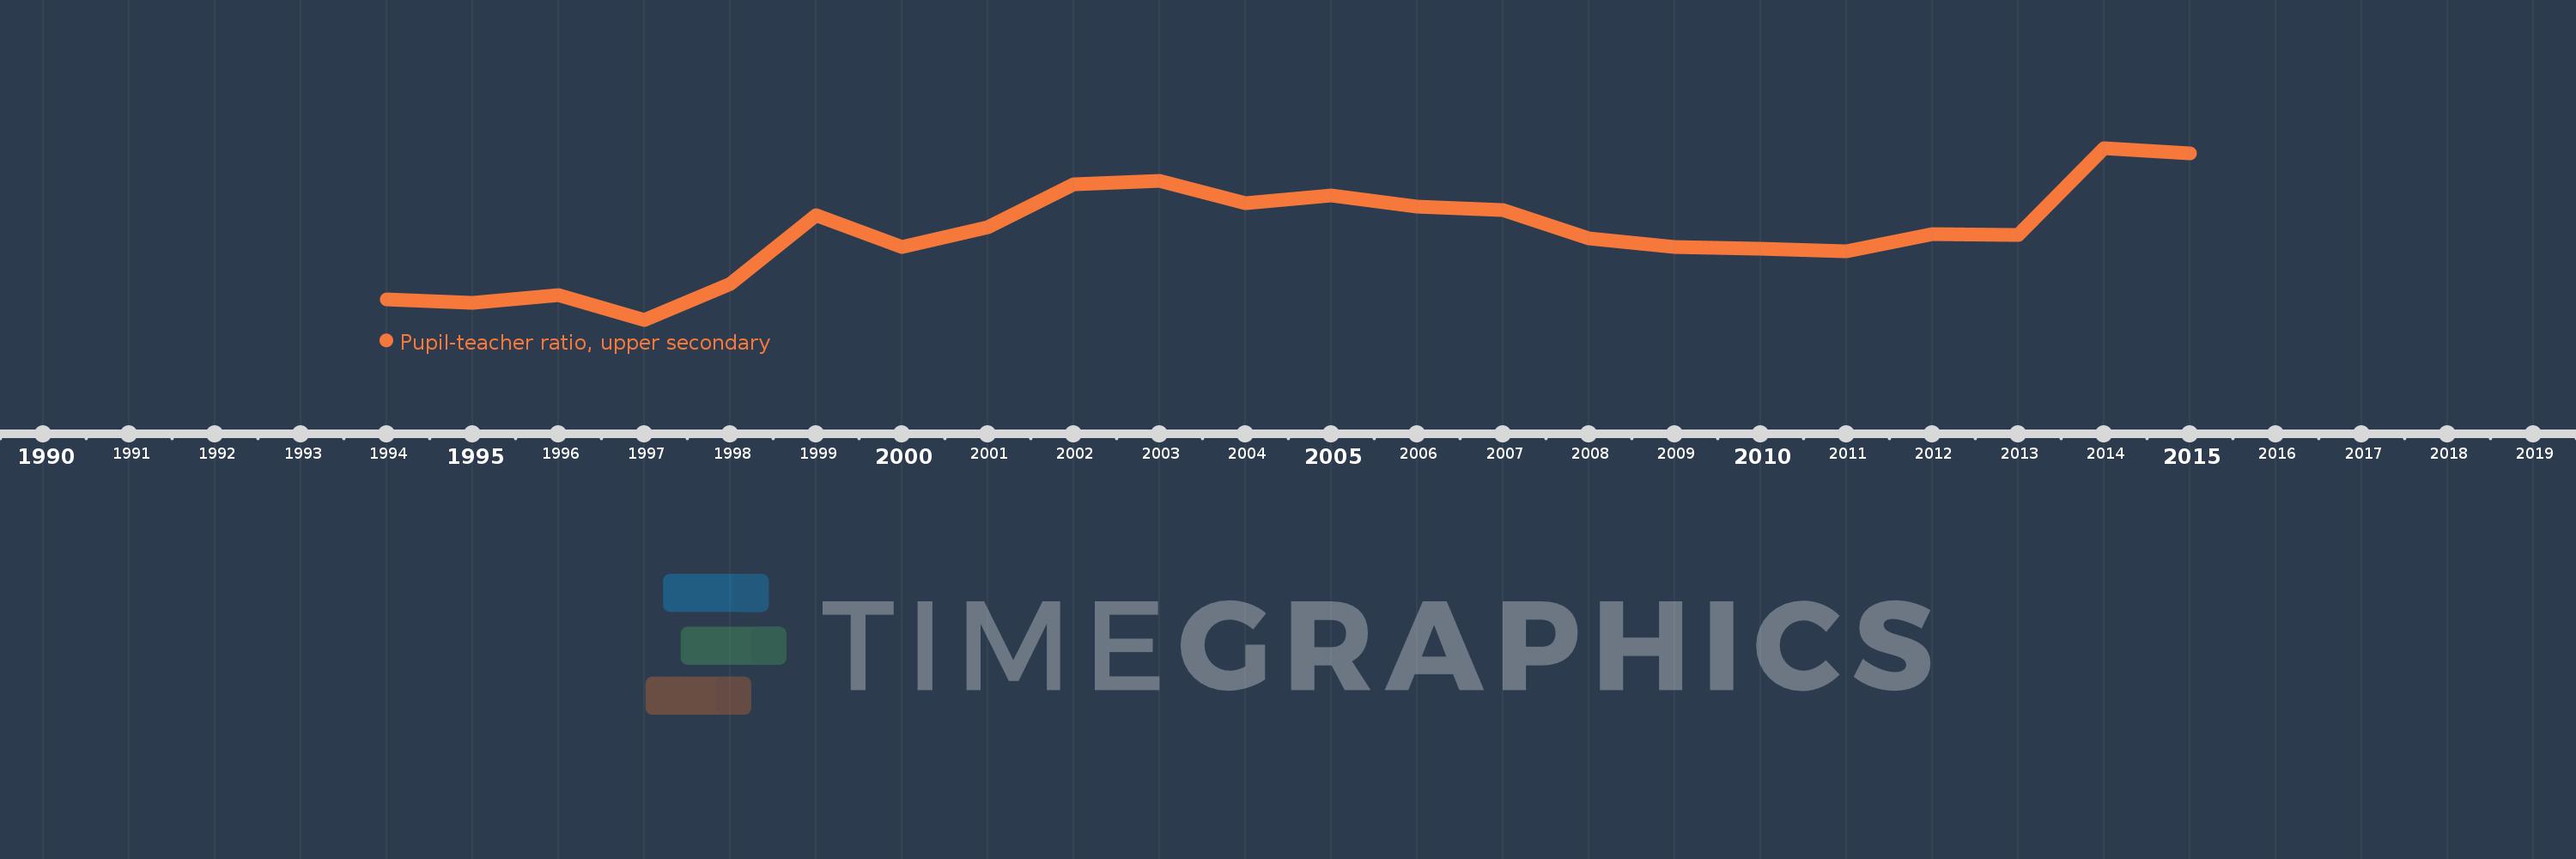
Pupil-teacher ratio, upper secondary
2015,2014,2013,2012,2011,2010,2009,2008,2007,2006,2005,2004,2003,2002,2001,2000,1999,1998,1997,1996,1995,1994
This statistics in other country:
Timeline:
This timeline shows a graph from 1994 to 2015 of World. No data until 1993. Number of actual observations by date: 22.
Source name:
World Development Indicators
Source organization:
United Nations Educational, Scientific, and Cultural Organization (UNESCO) Institute for Statistics.
Categories, topics:
Education
Last updated:
apr 23, 2017
Indicators value changes by year
Minimum:
14.677
jan 1, 1997
Maximum:
17.835
jan 1, 2014
At the date of observation
Value
Absolute change
Change from previous value
jan 1, 1994
15.056
+15.056
0.0%
jan 1, 1995
14.987
-0.069
-0.46%
jan 1, 1996
15.133
+0.145
0.97%
jan 1, 1997
14.677
-0.456
-3.01%
jan 1, 1998
15.334
+0.658
4.48%
jan 1, 1999
16.594
+1.259
8.21%
jan 1, 2000
16.022
-0.572
-3.45%
jan 1, 2001
16.385
+0.363
2.27%
jan 1, 2002
17.173
+0.788
4.81%
jan 1, 2003
17.238
+0.065
0.38%
jan 1, 2004
16.822
-0.416
-2.42%
jan 1, 2005
16.963
+0.141
0.84%
jan 1, 2006
16.751
-0.212
-1.25%
jan 1, 2007
16.693
-0.058
-0.35%
jan 1, 2008
16.171
-0.521
-3.12%
jan 1, 2009
16.01
-0.161
-1.0%
jan 1, 2010
15.978
-0.032
-0.2%
jan 1, 2011
15.936
-0.042
-0.26%
jan 1, 2012
16.258
+0.322
2.02%
jan 1, 2013
16.229
-0.029
-0.18%
jan 1, 2014
17.835
+1.606
9.89%
jan 1, 2015
17.735
-0.1
-0.56%
Ranking of countries by current statistics by years


Comments: