29
/
en
AIzaSyAYiBZKx7MnpbEhh9jyipgxe19OcubqV5w
April 1, 2024
207386
Nepal
NPL
true
2
1
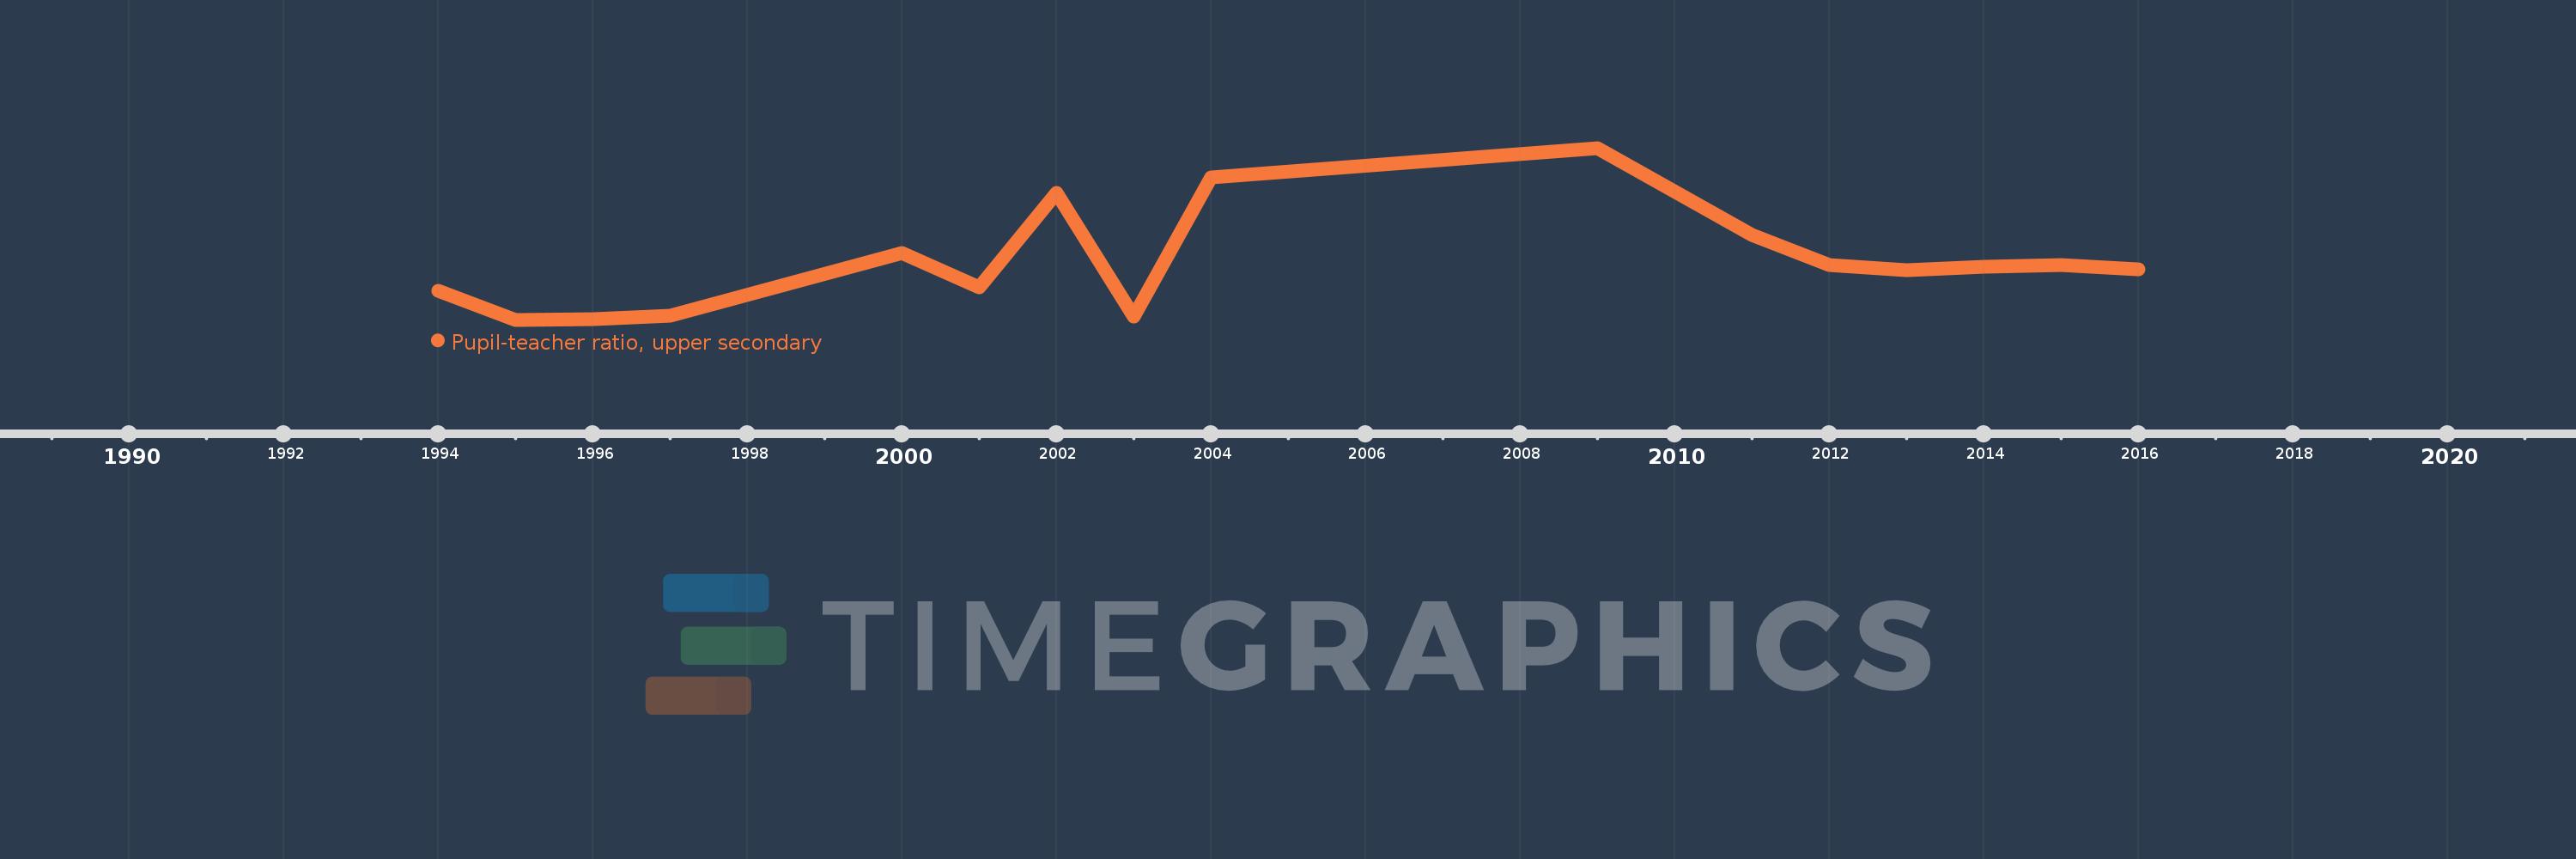
Pupil-teacher ratio, upper secondary
2016,2015,2014,2013,2012,2011,2009,2004,2003,2002,2001,2000,1997,1996,1995,1994
This statistics in other country:
Timeline:
This timeline shows a graph from 1994 to 2016 of Nepal. No data until 1993. Number of actual observations by date: 16.
Source name:
World Development Indicators
Source organization:
United Nations Educational, Scientific, and Cultural Organization (UNESCO) Institute for Statistics.
Categories, topics:
Education
Last updated:
apr 23, 2017
Indicators value changes by year
Maximum:
29.819
jan 1, 2009
At the date of observation
Value
Absolute change
Change from previous value
jan 1, 1994
21.551
+21.551
0.0%
jan 1, 1995
19.85
-1.701
-7.89%
jan 1, 1996
19.893
+0.043
0.22%
jan 1, 1997
20.084
+0.19
0.96%
jan 1, 2000
23.726
+3.642
18.13%
jan 1, 2001
21.711
-2.015
-8.49%
jan 1, 2002
27.206
+5.495
25.31%
jan 1, 2003
20.048
-7.158
-26.31%
jan 1, 2004
28.109
+8.061
40.21%
jan 1, 2009
29.819
+1.71
6.08%
jan 1, 2011
24.764
-5.055
-16.95%
jan 1, 2012
23.039
-1.725
-6.96%
jan 1, 2013
22.722
-0.317
-1.38%
jan 1, 2014
22.907
+0.185
0.81%
jan 1, 2015
23.007
+0.1
0.44%
jan 1, 2016
22.797
-0.21
-0.91%
Ranking of countries by current statistics by years


Comments: