29
/
en
AIzaSyAYiBZKx7MnpbEhh9jyipgxe19OcubqV5w
April 1, 2024
160940
Israel
ISR
true
2
1
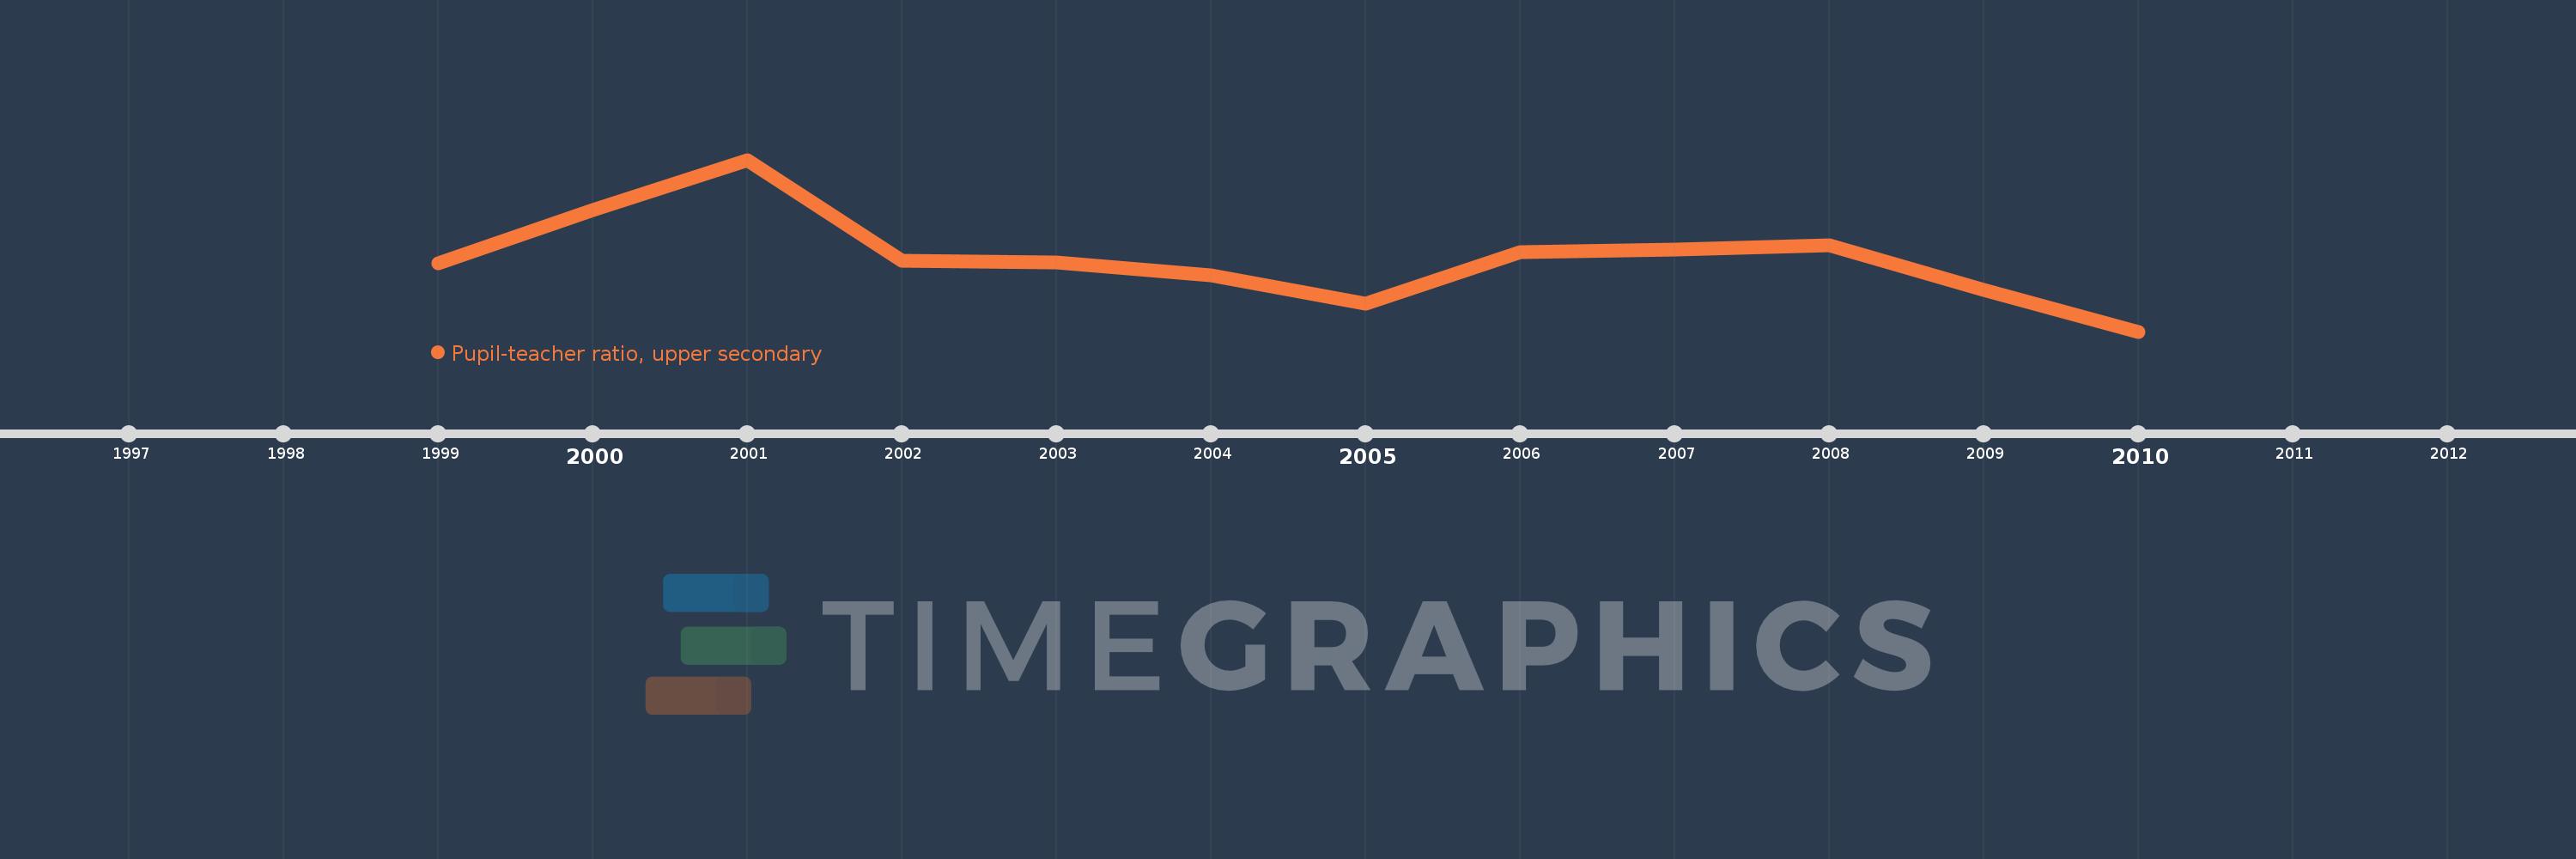
Pupil-teacher ratio, upper secondary
2010,2009,2008,2007,2006,2005,2004,2003,2002,2001,2000,1999
This statistics in other country:
Timeline:
This timeline shows a graph from 1999 to 2010 of Israel. No data until 1998. Number of actual observations by date: 12.
Source name:
World Development Indicators
Source organization:
United Nations Educational, Scientific, and Cultural Organization (UNESCO) Institute for Statistics.
Categories, topics:
Education
Last updated:
apr 23, 2017
Indicators value changes by year
At the date of observation
Value
Absolute change
Change from previous value
jan 1, 1999
9.104
+9.104
0.0%
jan 1, 2000
9.428
+0.323
3.55%
jan 1, 2001
9.732
+0.304
3.23%
jan 1, 2002
9.117
-0.615
-6.32%
jan 1, 2003
9.107
-0.009
-0.1%
jan 1, 2004
9.032
-0.075
-0.82%
jan 1, 2005
8.86
-0.172
-1.91%
jan 1, 2006
9.17
+0.31
3.49%
jan 1, 2007
9.186
+0.016
0.17%
jan 1, 2008
9.212
+0.027
0.29%
jan 1, 2009
8.942
-0.27
-2.93%
jan 1, 2010
8.688
-0.254
-2.85%
Ranking of countries by current statistics by years


Comments: