29
/
en
AIzaSyAYiBZKx7MnpbEhh9jyipgxe19OcubqV5w
April 1, 2024
50414
Middle East & North Africa (IDA & IBRD countries)
TMN
false
2
1
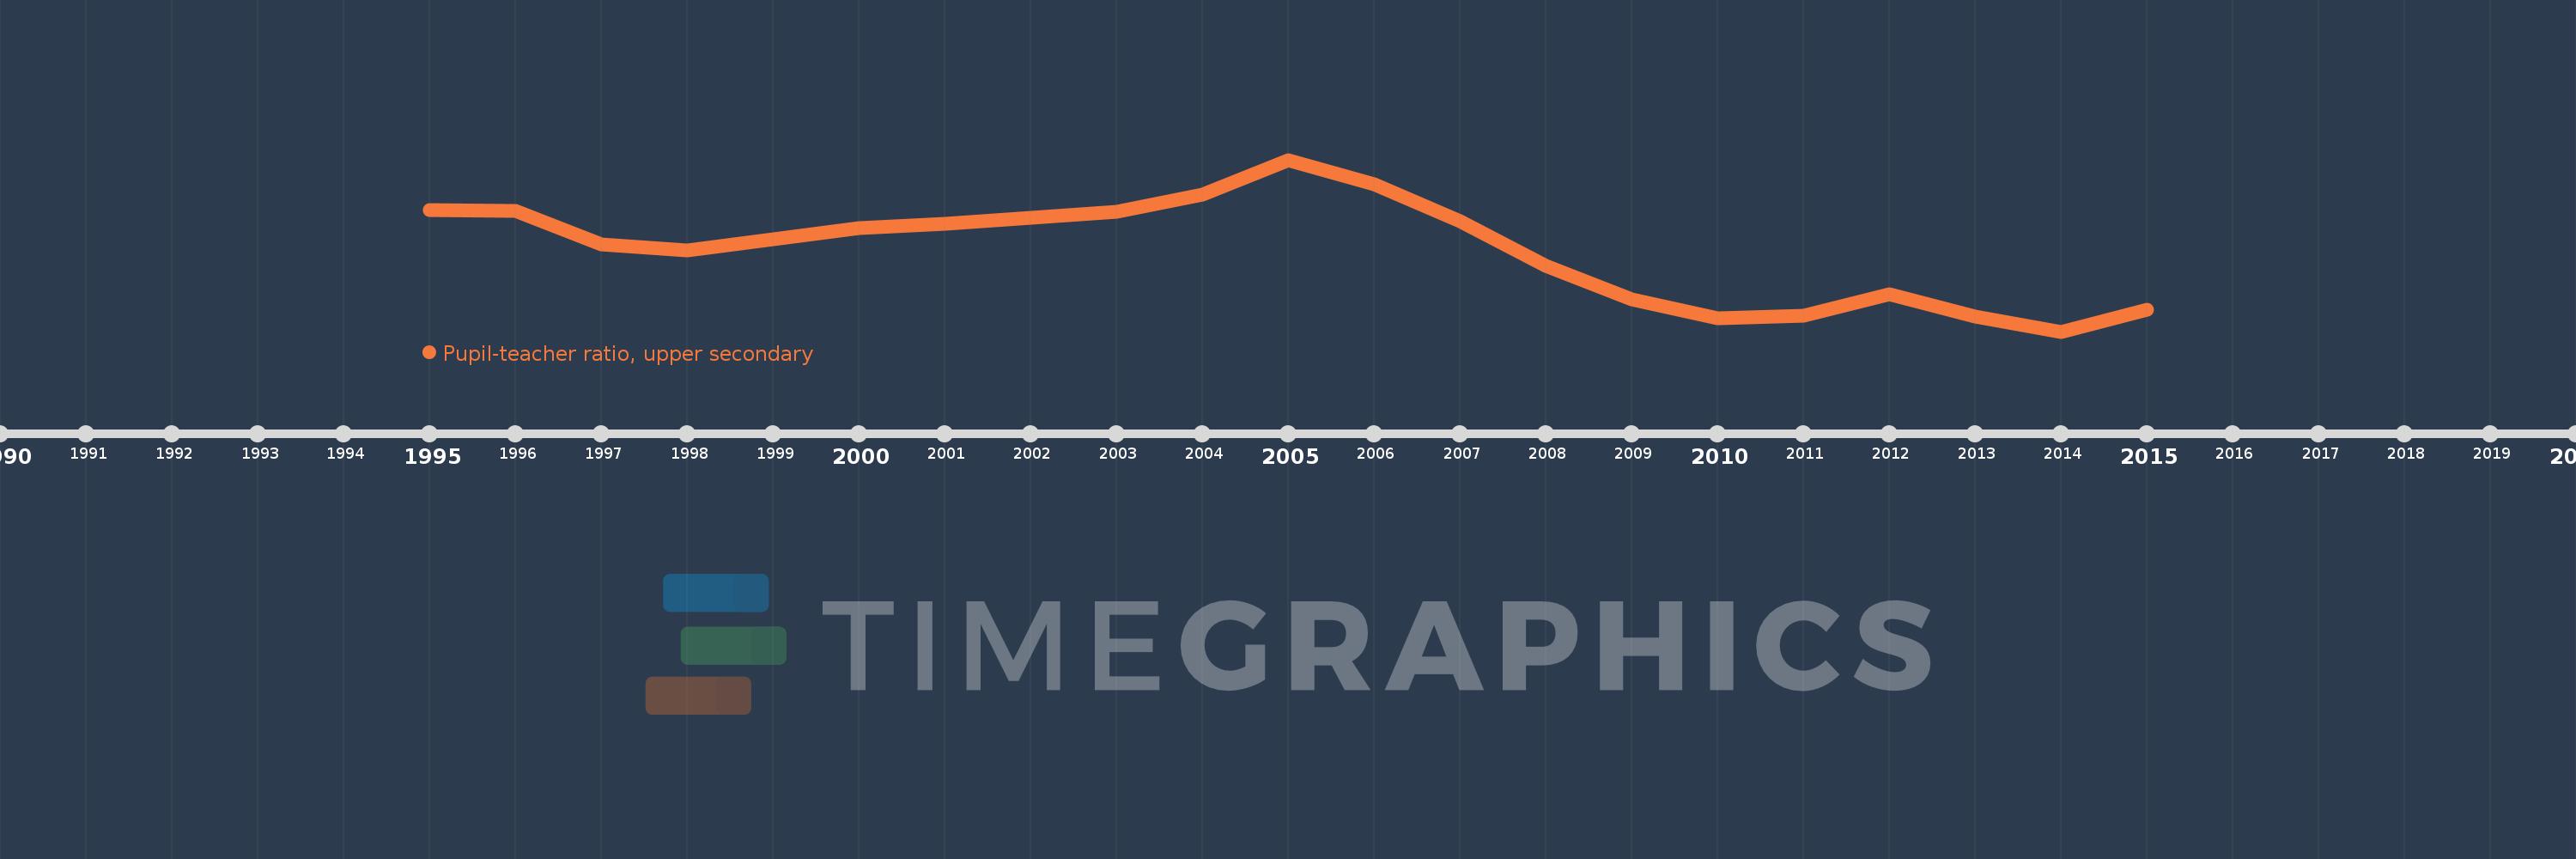
Pupil-teacher ratio, upper secondary
2015,2014,2013,2012,2011,2010,2009,2008,2007,2006,2005,2004,2003,2002,2001,2000,1999,1998,1997,1996,1995
This statistics in other country:
Timeline:
This timeline shows a graph from 1995 to 2015 of Middle East & North Africa (IDA & IBRD countries). No data until 1994. Number of actual observations by date: 21.
Source name:
World Development Indicators
Source organization:
United Nations Educational, Scientific, and Cultural Organization (UNESCO) Institute for Statistics.
Categories, topics:
Education
Last updated:
apr 23, 2017
Indicators value changes by year
Minimum:
13.962
jan 1, 2014
Maximum:
19.098
jan 1, 2005
At the date of observation
Value
Absolute change
Change from previous value
jan 1, 1995
17.598
+17.598
0.0%
jan 1, 1996
17.58
-0.018
-0.1%
jan 1, 1997
16.567
-1.012
-5.76%
jan 1, 1998
16.381
-0.186
-1.12%
jan 1, 1999
16.73
+0.348
2.13%
jan 1, 2000
17.049
+0.319
1.91%
jan 1, 2001
17.184
+0.135
0.79%
jan 1, 2002
17.355
+0.171
1.0%
jan 1, 2003
17.544
+0.189
1.09%
jan 1, 2004
18.066
+0.522
2.98%
jan 1, 2005
19.098
+1.032
5.71%
jan 1, 2006
18.368
-0.731
-3.83%
jan 1, 2007
17.255
-1.113
-6.06%
jan 1, 2008
15.926
-1.329
-7.7%
jan 1, 2009
14.924
-1.002
-6.29%
jan 1, 2010
14.356
-0.569
-3.81%
jan 1, 2011
14.437
+0.082
0.57%
jan 1, 2012
15.088
+0.651
4.51%
jan 1, 2013
14.416
-0.673
-4.46%
jan 1, 2014
13.962
-0.454
-3.15%
jan 1, 2015
14.608
+0.646
4.63%
Ranking of countries by current statistics by years


Comments: