29
/
en
AIzaSyAYiBZKx7MnpbEhh9jyipgxe19OcubqV5w
April 1, 2024
85404
Bermuda
BMU
true
2
1
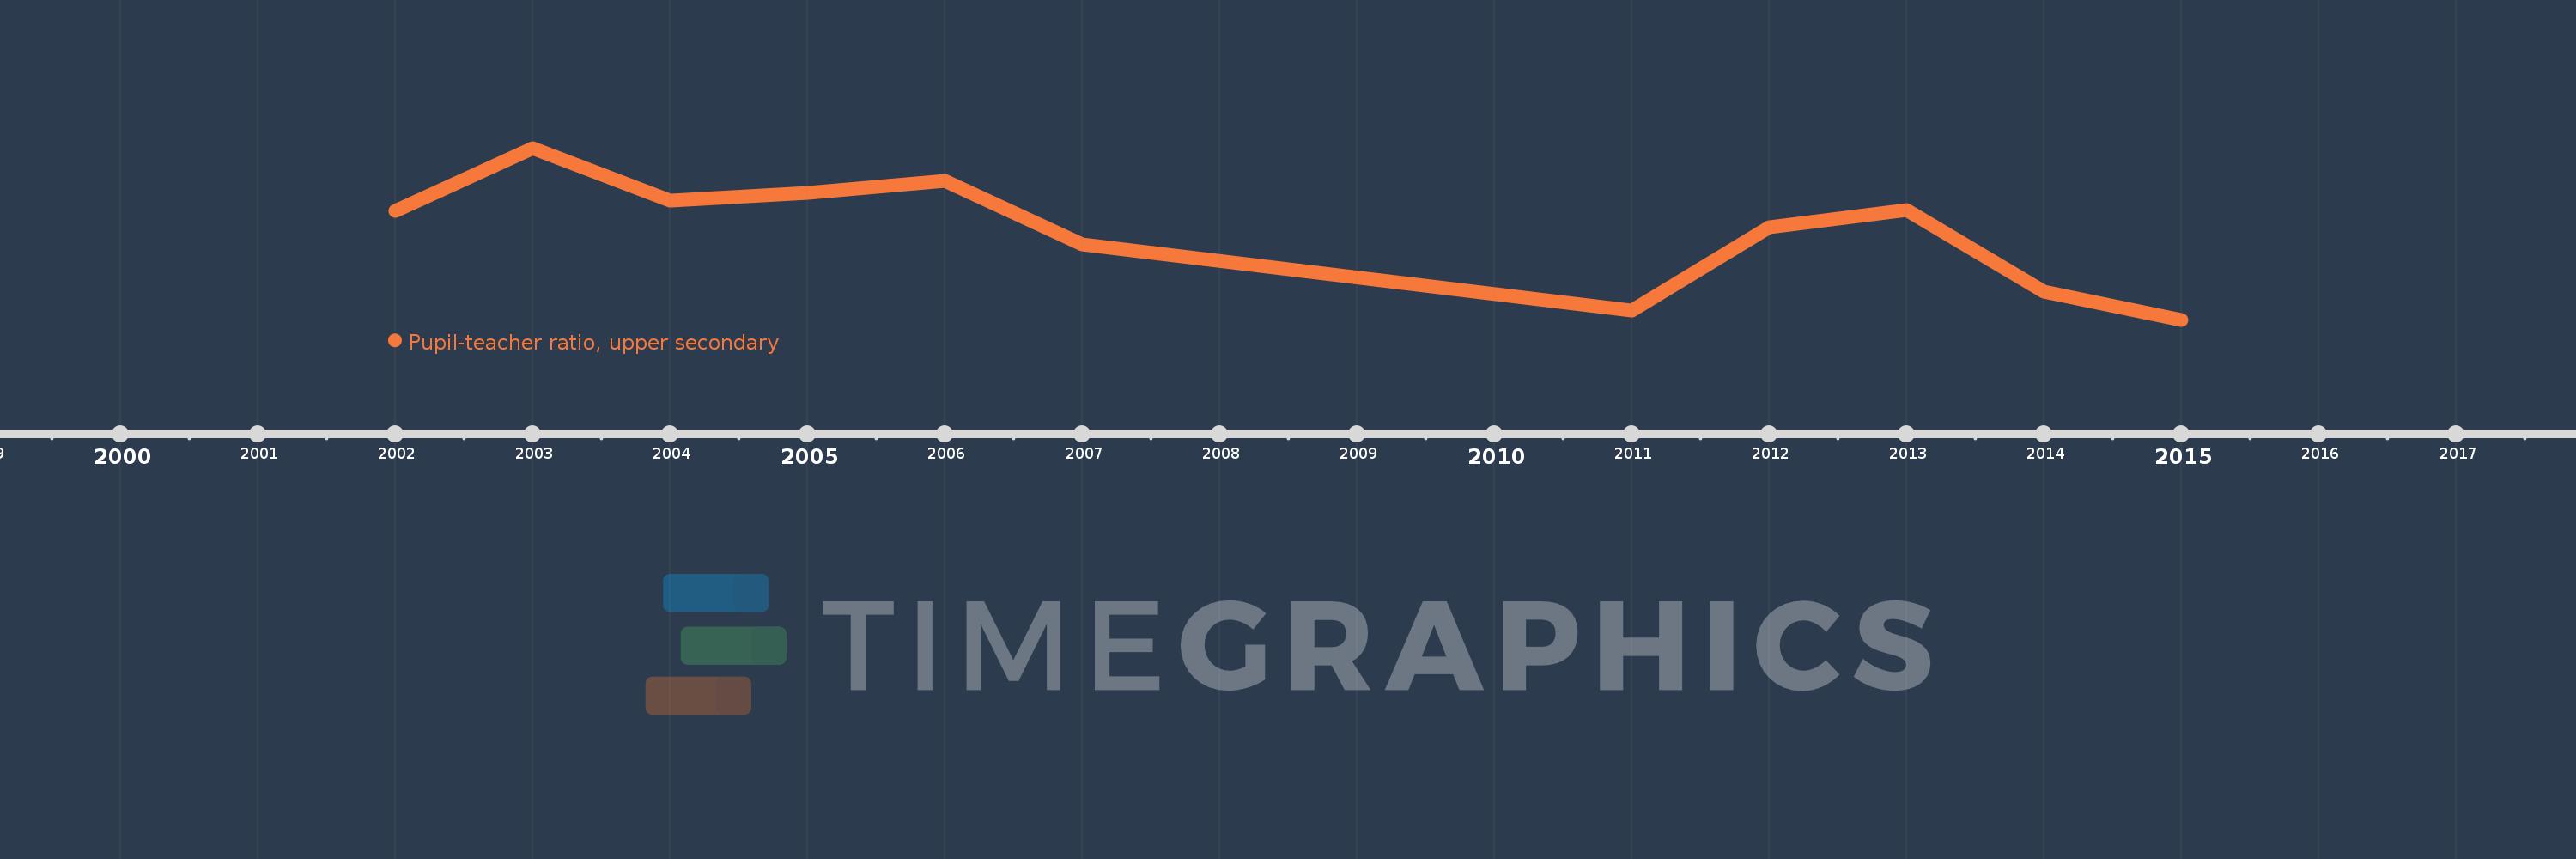
Pupil-teacher ratio, upper secondary
2015,2014,2013,2012,2011,2007,2006,2005,2004,2003,2002
This statistics in other country:
Timeline:
This timeline shows a graph from 2002 to 2015 of Bermuda. No data until 2001. Number of actual observations by date: 11.
Source name:
World Development Indicators
Source organization:
United Nations Educational, Scientific, and Cultural Organization (UNESCO) Institute for Statistics.
Categories, topics:
Education
Last updated:
apr 23, 2017
Indicators value changes by year
At the date of observation
Value
Absolute change
Change from previous value
jan 1, 2002
6.629
+6.629
0.0%
jan 1, 2003
7.342
+0.713
10.75%
jan 1, 2004
6.748
-0.594
-8.09%
jan 1, 2005
6.834
+0.086
1.27%
jan 1, 2006
6.964
+0.13
1.9%
jan 1, 2007
6.25
-0.714
-10.25%
jan 1, 2011
5.492
-0.758
-12.13%
jan 1, 2012
6.442
+0.951
17.31%
jan 1, 2013
6.633
+0.19
2.95%
jan 1, 2014
5.713
-0.919
-13.86%
jan 1, 2015
5.389
-0.324
-5.67%
Ranking of countries by current statistics by years


Comments: