29
/
en
AIzaSyAYiBZKx7MnpbEhh9jyipgxe19OcubqV5w
April 1, 2024
247991
Spain
ESP
true
2
1
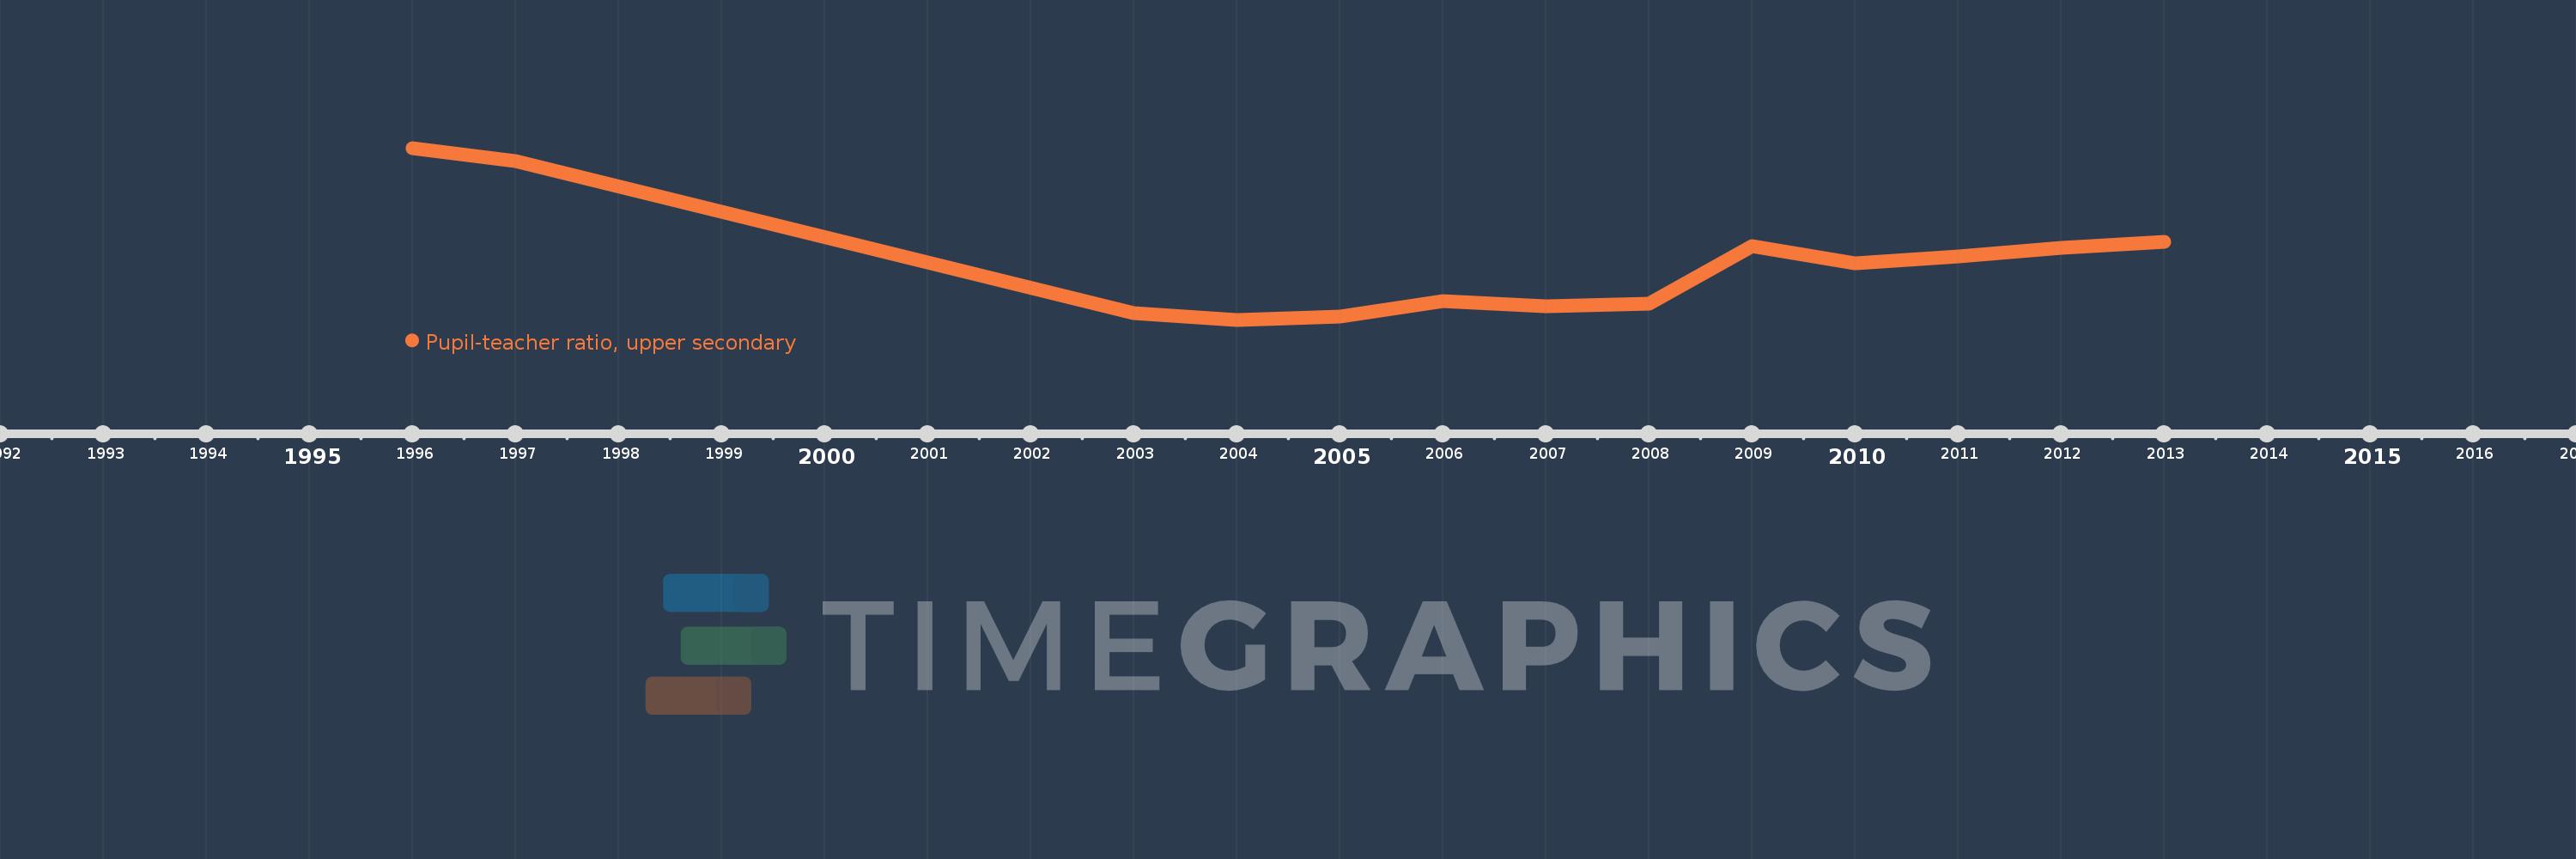
Pupil-teacher ratio, upper secondary
2013,2012,2011,2010,2009,2008,2007,2006,2005,2004,2003,1997,1996
This statistics in other country:
Timeline:
This timeline shows a graph from 1996 to 2013 of Spain. No data until 1995. Number of actual observations by date: 13.
Source name:
World Development Indicators
Source organization:
United Nations Educational, Scientific, and Cultural Organization (UNESCO) Institute for Statistics.
Categories, topics:
Education
Last updated:
apr 23, 2017
Indicators value changes by year
Maximum:
15.046
jan 1, 1996
At the date of observation
Value
Absolute change
Change from previous value
jan 1, 1996
15.046
+15.046
0.0%
jan 1, 1997
14.575
-0.472
-3.14%
jan 1, 2003
8.943
-5.631
-38.64%
jan 1, 2004
8.694
-0.25
-2.79%
jan 1, 2005
8.824
+0.13
1.49%
jan 1, 2006
9.386
+0.563
6.38%
jan 1, 2007
9.19
-0.197
-2.1%
jan 1, 2008
9.296
+0.106
1.16%
jan 1, 2009
11.402
+2.106
22.65%
jan 1, 2010
10.788
-0.613
-5.38%
jan 1, 2011
11.048
+0.26
2.41%
jan 1, 2012
11.349
+0.301
2.72%
jan 1, 2013
11.585
+0.236
2.08%
Ranking of countries by current statistics by years


Comments: