29
/
en
AIzaSyAYiBZKx7MnpbEhh9jyipgxe19OcubqV5w
April 1, 2024
48511
Middle East & North Africa
MEA
false
2
1
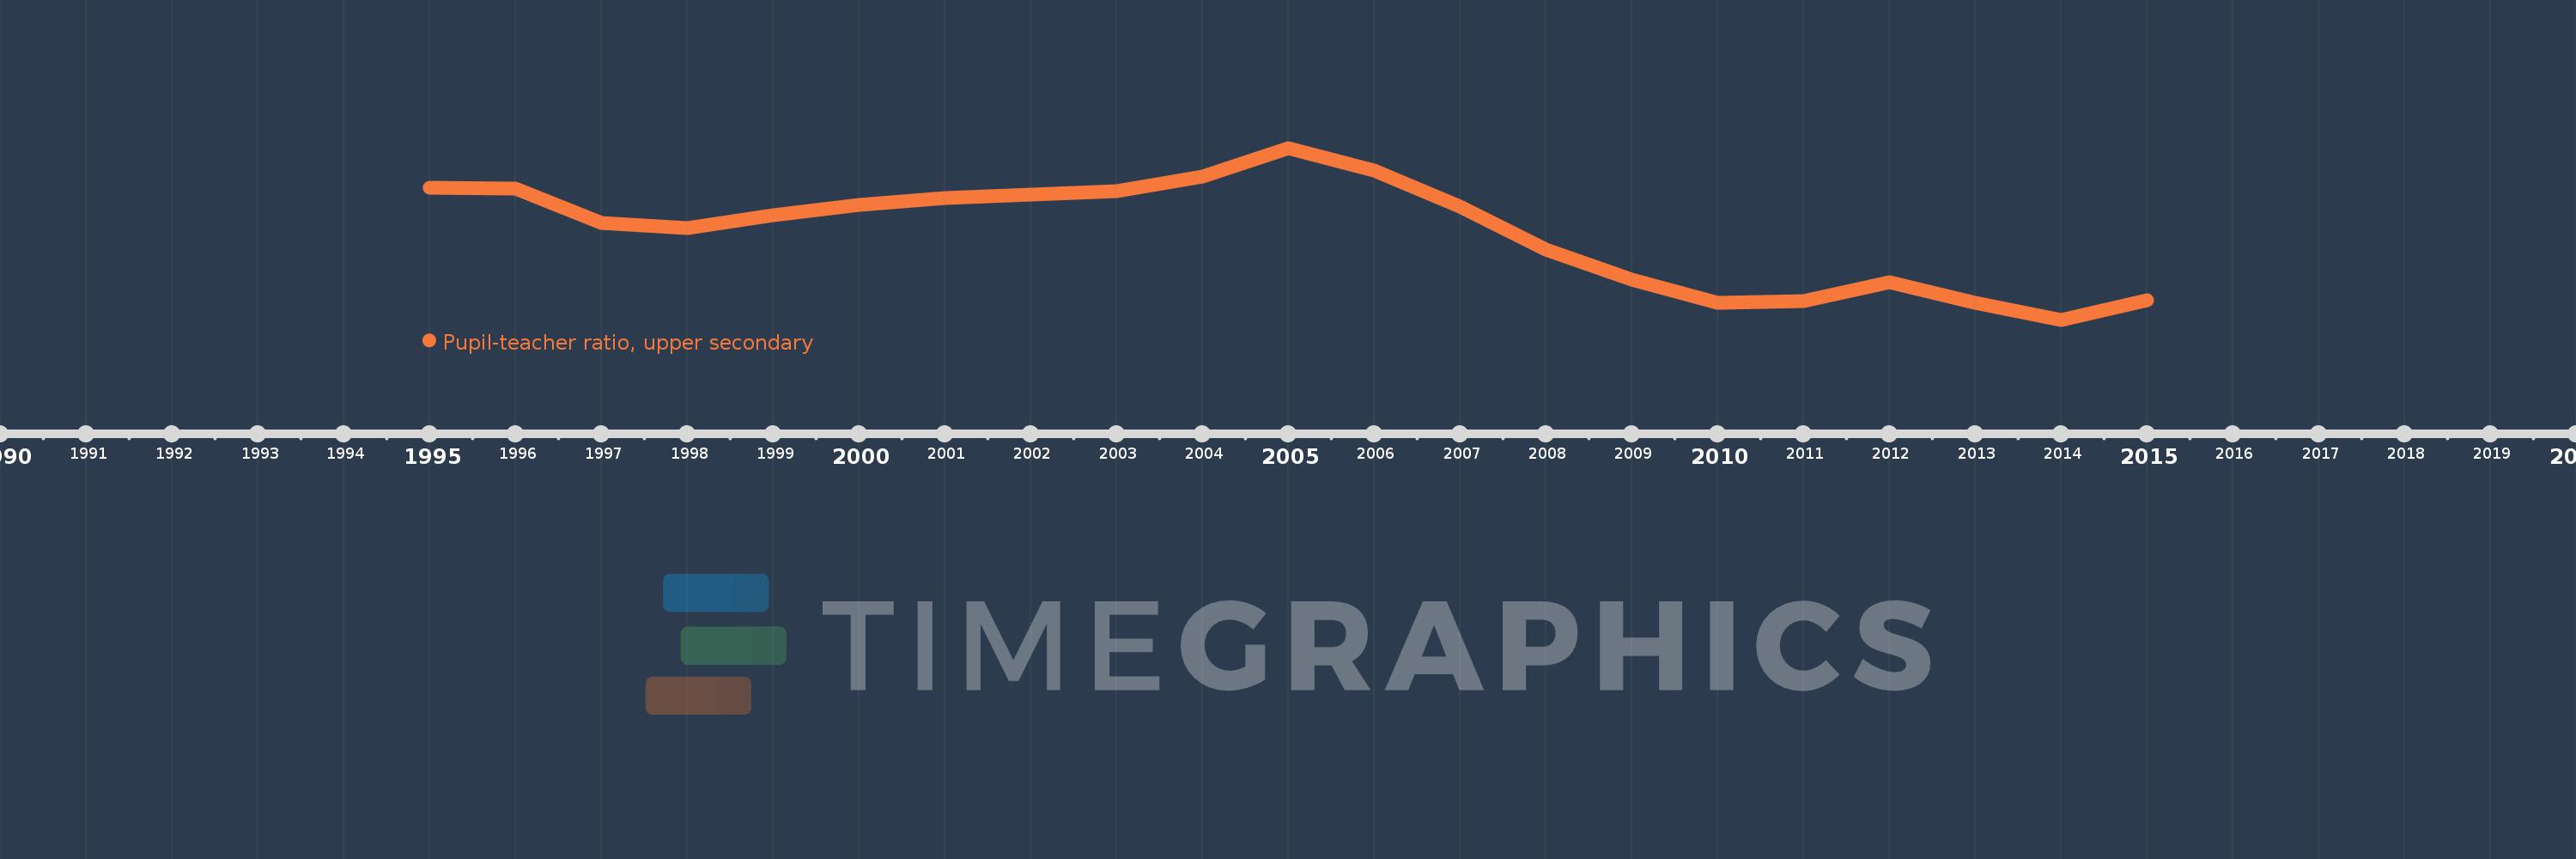
Pupil-teacher ratio, upper secondary
2015,2014,2013,2012,2011,2010,2009,2008,2007,2006,2005,2004,2003,2002,2001,2000,1999,1998,1997,1996,1995
This statistics in other country:
Timeline:
This timeline shows a graph from 1995 to 2015 of Middle East & North Africa. No data until 1994. Number of actual observations by date: 21.
Source name:
World Development Indicators
Source organization:
United Nations Educational, Scientific, and Cultural Organization (UNESCO) Institute for Statistics.
Categories, topics:
Education
Last updated:
apr 23, 2017
Indicators value changes by year
Minimum:
13.273
jan 1, 2014
Maximum:
17.639
jan 1, 2005
At the date of observation
Value
Absolute change
Change from previous value
jan 1, 1995
16.638
+16.638
0.0%
jan 1, 1996
16.615
-0.023
-0.14%
jan 1, 1997
15.744
-0.871
-5.24%
jan 1, 1998
15.608
-0.136
-0.86%
jan 1, 1999
15.922
+0.314
2.01%
jan 1, 2000
16.195
+0.273
1.71%
jan 1, 2001
16.364
+0.169
1.05%
jan 1, 2002
16.447
+0.083
0.51%
jan 1, 2003
16.55
+0.103
0.63%
jan 1, 2004
16.915
+0.365
2.21%
jan 1, 2005
17.639
+0.724
4.28%
jan 1, 2006
17.059
-0.58
-3.29%
jan 1, 2007
16.149
-0.91
-5.33%
jan 1, 2008
15.064
-1.085
-6.72%
jan 1, 2009
14.282
-0.782
-5.19%
jan 1, 2010
13.699
-0.583
-4.08%
jan 1, 2011
13.742
+0.043
0.32%
jan 1, 2012
14.23
+0.488
3.55%
jan 1, 2013
13.698
-0.532
-3.74%
jan 1, 2014
13.273
-0.425
-3.1%
jan 1, 2015
13.773
+0.499
3.76%
Ranking of countries by current statistics by years


Comments: