29
/
en
AIzaSyAYiBZKx7MnpbEhh9jyipgxe19OcubqV5w
April 1, 2024
52975
OECD members
OED
false
2
1
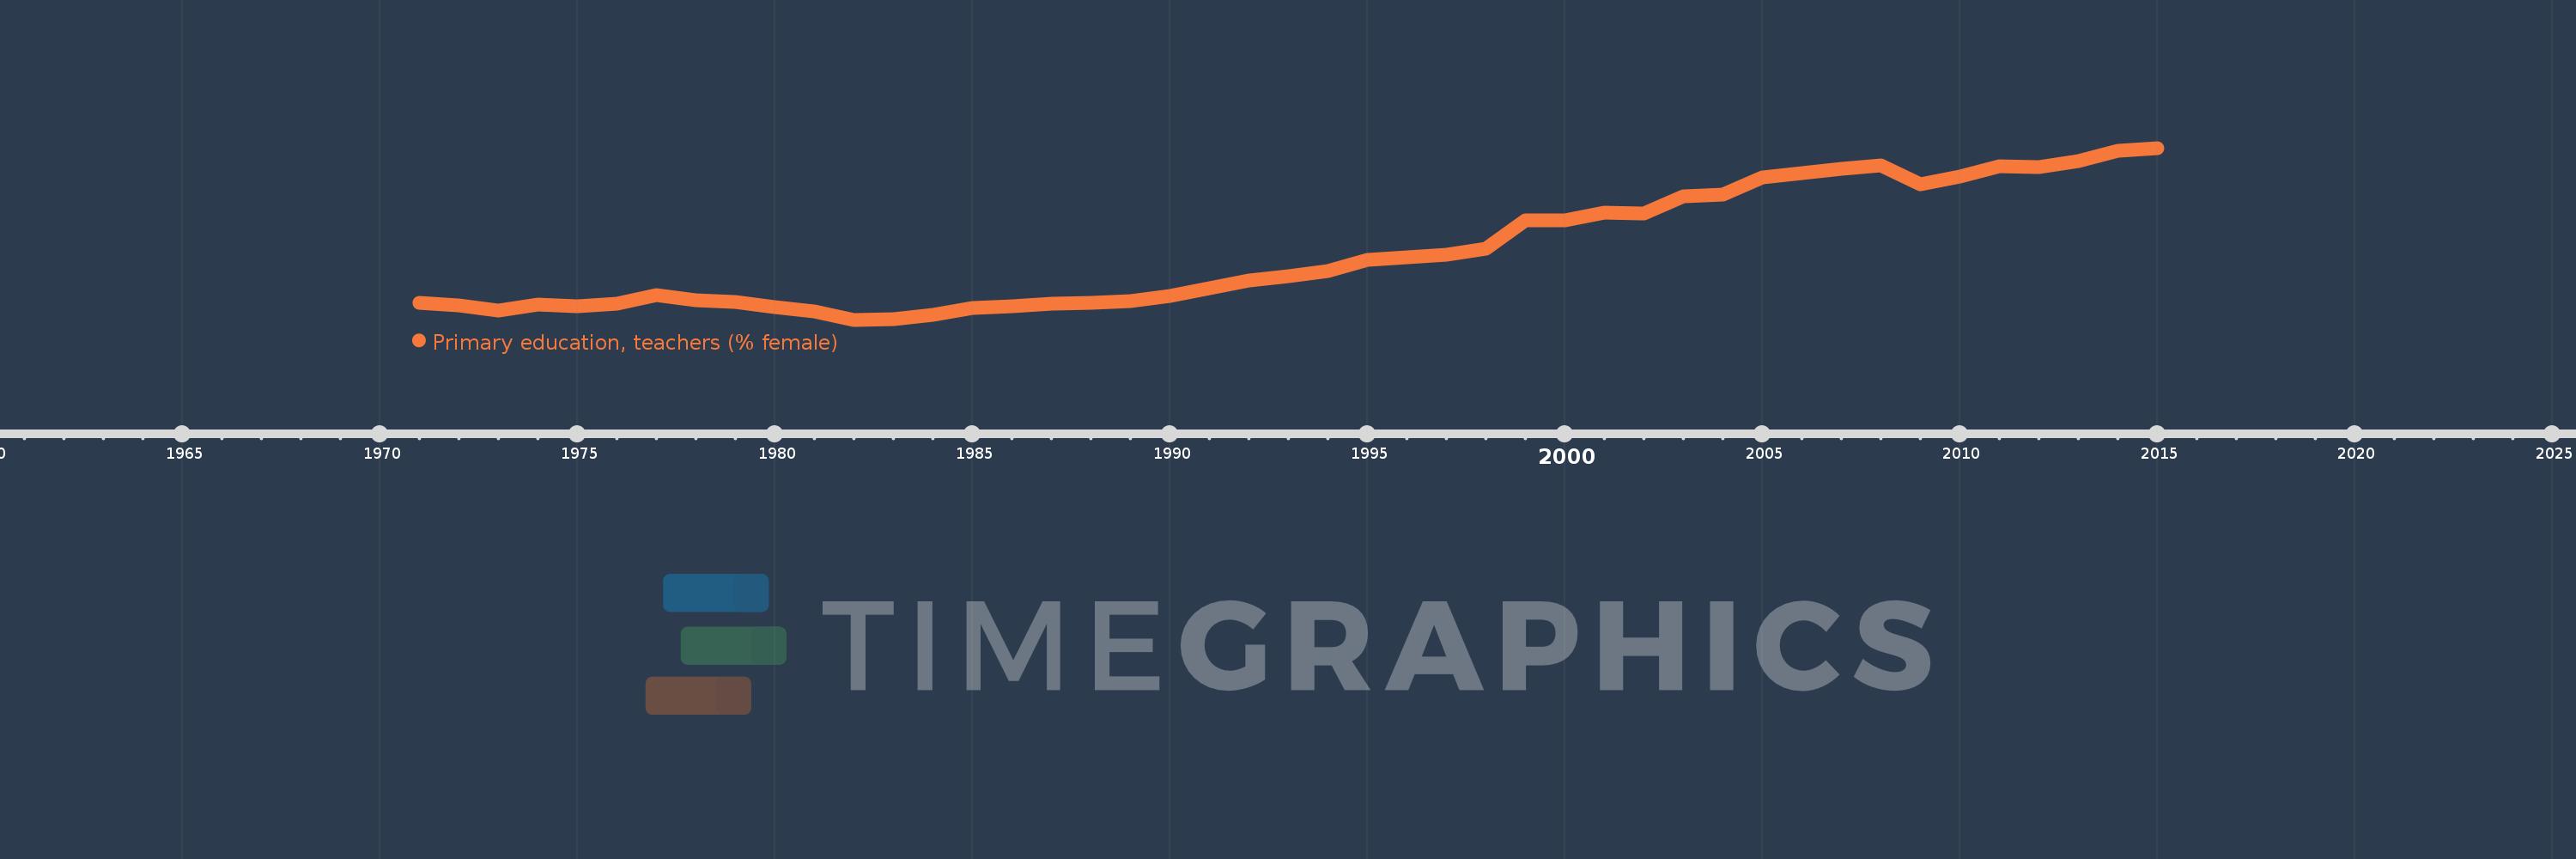
Primary education, teachers (% female)
2015,2014,2013,2012,2011,2010,2009,2008,2007,2006,2005,2004,2003,2002,2001,2000,1999,1998,1997,1996,1995,1994,1993,1992,1991,1990,1989,1988,1987,1986,1985,1984,1983,1982,1981,1980,1979,1978,1977,1976,1975,1974,1973,1972,1971
This statistics in other country:
AfghanistanAlbaniaAlgeriaAndorraAngolaAntigua and BarbudaArab WorldArgentinaArmeniaArubaAustraliaAustriaAzerbaijanBahamas, TheBahrainBangladeshBarbadosBelarusBelgiumBelizeBeninBermudaBhutanBoliviaBosnia and HerzegovinaBotswanaBrazilBritish Virgin IslandsBrunei DarussalamBulgariaBurkina FasoBurundiCabo VerdeCambodiaCameroonCanadaCaribbean small statesCayman IslandsCentral African RepublicCentral Europe and the BalticsChadChileChinaColombiaComorosCongo, Dem. Rep.Congo, Rep.Costa RicaCote d'IvoireCroatiaCubaCyprusCzech RepublicDenmarkDjiboutiDominicaDominican RepublicEarly-demographic dividendEast Asia & PacificEast Asia & Pacific (excluding high income)East Asia & Pacific (IDA & IBRD countries)EcuadorEgypt, Arab Rep.El SalvadorEquatorial GuineaEritreaEstoniaEthiopiaEuro areaEurope & Central AsiaEurope & Central Asia (excluding high income)Europe & Central Asia (IDA & IBRD countries)European UnionFijiFinlandFragile and conflict affected situationsFranceGabonGambia, TheGeorgiaGermanyGhanaGibraltarGreeceGrenadaGuatemalaGuineaGuinea-BissauGuyanaHaitiHeavily indebted poor countries (HIPC)High incomeHondurasHong Kong SAR, ChinaHungaryIBRD onlyIcelandIDA & IBRD totalIDA blendIDA onlyIDA totalIndiaIndonesiaIran, Islamic Rep.IraqIrelandIsraelItalyJamaicaJapanJordanKazakhstanKenyaKiribatiKorea, Dem. People’s Rep.Korea, Rep.KuwaitKyrgyz RepublicLao PDRLate-demographic dividendLatin America & Caribbean Latin America & Caribbean (excluding high income)Latin America & the Caribbean (IDA & IBRD countries)LatviaLeast developed countries: UN classificationLebanonLesothoLiberiaLibyaLiechtensteinLithuaniaLow & middle incomeLow incomeLower middle incomeLuxembourgMacao SAR, ChinaMacedonia, FYRMadagascarMalawiMalaysiaMaldivesMaliMaltaMarshall IslandsMauritaniaMauritiusMexicoMiddle East & North AfricaMiddle East & North Africa (excluding high income)Middle East & North Africa (IDA & IBRD countries)Middle incomeMoldovaMonacoMongoliaMoroccoMozambiqueMyanmarNamibiaNauruNepalNetherlandsNew ZealandNicaraguaNigerNigeriaNorth AmericaNorwayOECD membersOmanOther small statesPacific island small statesPakistanPalauPanamaPapua New GuineaParaguayPeruPhilippinesPolandPortugalPost-demographic dividendPre-demographic dividendPuerto RicoQatarRomaniaRussian FederationRwandaSamoaSan MarinoSao Tome and PrincipeSaudi ArabiaSenegalSerbiaSeychellesSierra LeoneSingaporeSint Maarten (Dutch part)Slovak RepublicSloveniaSmall statesSolomon IslandsSomaliaSouth AfricaSouth AsiaSouth Asia (IDA & IBRD)South SudanSpainSri LankaSt. Kitts and NevisSt. LuciaSt. Vincent and the GrenadinesSub-Saharan Africa Sub-Saharan Africa (excluding high income)Sub-Saharan Africa (IDA & IBRD countries)SudanSurinameSwazilandSwedenSwitzerlandSyrian Arab RepublicTajikistanTanzaniaThailandTimor-LesteTogoTongaTrinidad and TobagoTunisiaTurkeyTurks and Caicos IslandsTuvaluUgandaUkraineUnited Arab EmiratesUnited KingdomUnited StatesUpper middle incomeUruguayUzbekistanVanuatuVenezuela, RBVietnamWest Bank and GazaWorldYemen, Rep.ZambiaZimbabwe Timeline:
This timeline shows a graph from 1971 to 2015 of OECD members. No data until 1970. Number of actual observations by date: 45.
Source name:
World Development Indicators
Source organization:
United Nations Educational, Scientific, and Cultural Organization (UNESCO) Institute for Statistics.
Categories, topics:
Education, Gender
Last updated:
apr 23, 2017
Indicators value changes by year
Minimum:
73.309
jan 1, 1982
Maximum:
80.177
jan 1, 2015
At the date of observation
Value
Absolute change
Change from previous value
jan 1, 1971
73.99
+73.99
0.0%
jan 1, 1972
73.879
-0.111
-0.15%
jan 1, 1973
73.674
-0.205
-0.28%
jan 1, 1974
73.926
+0.252
0.34%
jan 1, 1975
73.863
-0.063
-0.09%
jan 1, 1976
73.94
+0.077
0.1%
jan 1, 1977
74.302
+0.362
0.49%
jan 1, 1978
74.081
-0.221
-0.3%
jan 1, 1979
74.005
-0.076
-0.1%
jan 1, 1980
73.812
-0.193
-0.26%
jan 1, 1981
73.629
-0.183
-0.25%
jan 1, 1982
73.309
-0.321
-0.44%
jan 1, 1983
73.343
+0.035
0.05%
jan 1, 1984
73.496
+0.152
0.21%
jan 1, 1985
73.772
+0.277
0.38%
jan 1, 1986
73.844
+0.072
0.1%
jan 1, 1987
73.937
+0.092
0.13%
jan 1, 1988
73.998
+0.061
0.08%
jan 1, 1989
74.048
+0.051
0.07%
jan 1, 1990
74.261
+0.212
0.29%
jan 1, 1991
74.567
+0.306
0.41%
jan 1, 1992
74.888
+0.321
0.43%
jan 1, 1993
75.065
+0.176
0.24%
jan 1, 1994
75.256
+0.191
0.25%
jan 1, 1995
75.707
+0.451
0.6%
jan 1, 1996
75.821
+0.114
0.15%
jan 1, 1997
75.92
+0.099
0.13%
jan 1, 1998
76.144
+0.224
0.3%
jan 1, 1999
77.278
+1.133
1.49%
jan 1, 2000
77.27
-0.008
-0.01%
jan 1, 2001
77.594
+0.324
0.42%
jan 1, 2002
77.57
-0.023
-0.03%
jan 1, 2003
78.228
+0.657
0.85%
jan 1, 2004
78.311
+0.084
0.11%
jan 1, 2005
78.994
+0.682
0.87%
jan 1, 2006
79.155
+0.161
0.2%
jan 1, 2007
79.352
+0.197
0.25%
jan 1, 2008
79.465
+0.114
0.14%
jan 1, 2009
78.738
-0.727
-0.91%
jan 1, 2010
79.046
+0.308
0.39%
jan 1, 2011
79.46
+0.414
0.52%
jan 1, 2012
79.426
-0.034
-0.04%
jan 1, 2013
79.641
+0.215
0.27%
jan 1, 2014
80.064
+0.423
0.53%
jan 1, 2015
80.177
+0.112
0.14%
Ranking of countries by current statistics by years


Comments: