29
/
en
AIzaSyAYiBZKx7MnpbEhh9jyipgxe19OcubqV5w
April 1, 2024
178212
Lesotho
LSO
true
2
1
Primary education, teachers (% female)
2015,2014,2013,2011,2010,2009,2008,2007,2006,2005,2004,2003,2002,2001,2000,1998,1997,1996,1995,1994,1993,1992,1991,1990,1989,1988,1987,1986,1985,1984,1983,1982,1981,1980,1979,1978,1977,1976,1975,1974,1973,1971
This statistics in other country:
AfghanistanAlbaniaAlgeriaAndorraAngolaAntigua and BarbudaArab WorldArgentinaArmeniaArubaAustraliaAustriaAzerbaijanBahamas, TheBahrainBangladeshBarbadosBelarusBelgiumBelizeBeninBermudaBhutanBoliviaBosnia and HerzegovinaBotswanaBrazilBritish Virgin IslandsBrunei DarussalamBulgariaBurkina FasoBurundiCabo VerdeCambodiaCameroonCanadaCaribbean small statesCayman IslandsCentral African RepublicCentral Europe and the BalticsChadChileChinaColombiaComorosCongo, Dem. Rep.Congo, Rep.Costa RicaCote d'IvoireCroatiaCubaCyprusCzech RepublicDenmarkDjiboutiDominicaDominican RepublicEarly-demographic dividendEast Asia & PacificEast Asia & Pacific (excluding high income)East Asia & Pacific (IDA & IBRD countries)EcuadorEgypt, Arab Rep.El SalvadorEquatorial GuineaEritreaEstoniaEthiopiaEuro areaEurope & Central AsiaEurope & Central Asia (excluding high income)Europe & Central Asia (IDA & IBRD countries)European UnionFijiFinlandFragile and conflict affected situationsFranceGabonGambia, TheGeorgiaGermanyGhanaGibraltarGreeceGrenadaGuatemalaGuineaGuinea-BissauGuyanaHaitiHeavily indebted poor countries (HIPC)High incomeHondurasHong Kong SAR, ChinaHungaryIBRD onlyIcelandIDA & IBRD totalIDA blendIDA onlyIDA totalIndiaIndonesiaIran, Islamic Rep.IraqIrelandIsraelItalyJamaicaJapanJordanKazakhstanKenyaKiribatiKorea, Dem. People’s Rep.Korea, Rep.KuwaitKyrgyz RepublicLao PDRLate-demographic dividendLatin America & Caribbean Latin America & Caribbean (excluding high income)Latin America & the Caribbean (IDA & IBRD countries)LatviaLeast developed countries: UN classificationLebanonLesothoLiberiaLibyaLiechtensteinLithuaniaLow & middle incomeLow incomeLower middle incomeLuxembourgMacao SAR, ChinaMacedonia, FYRMadagascarMalawiMalaysiaMaldivesMaliMaltaMarshall IslandsMauritaniaMauritiusMexicoMiddle East & North AfricaMiddle East & North Africa (excluding high income)Middle East & North Africa (IDA & IBRD countries)Middle incomeMoldovaMonacoMongoliaMoroccoMozambiqueMyanmarNamibiaNauruNepalNetherlandsNew ZealandNicaraguaNigerNigeriaNorth AmericaNorwayOECD membersOmanOther small statesPacific island small statesPakistanPalauPanamaPapua New GuineaParaguayPeruPhilippinesPolandPortugalPost-demographic dividendPre-demographic dividendPuerto RicoQatarRomaniaRussian FederationRwandaSamoaSan MarinoSao Tome and PrincipeSaudi ArabiaSenegalSerbiaSeychellesSierra LeoneSingaporeSint Maarten (Dutch part)Slovak RepublicSloveniaSmall statesSolomon IslandsSomaliaSouth AfricaSouth AsiaSouth Asia (IDA & IBRD)South SudanSpainSri LankaSt. Kitts and NevisSt. LuciaSt. Vincent and the GrenadinesSub-Saharan Africa Sub-Saharan Africa (excluding high income)Sub-Saharan Africa (IDA & IBRD countries)SudanSurinameSwazilandSwedenSwitzerlandSyrian Arab RepublicTajikistanTanzaniaThailandTimor-LesteTogoTongaTrinidad and TobagoTunisiaTurkeyTurks and Caicos IslandsTuvaluUgandaUkraineUnited Arab EmiratesUnited KingdomUnited StatesUpper middle incomeUruguayUzbekistanVanuatuVenezuela, RBVietnamWest Bank and GazaWorldYemen, Rep.ZambiaZimbabwe Timeline:
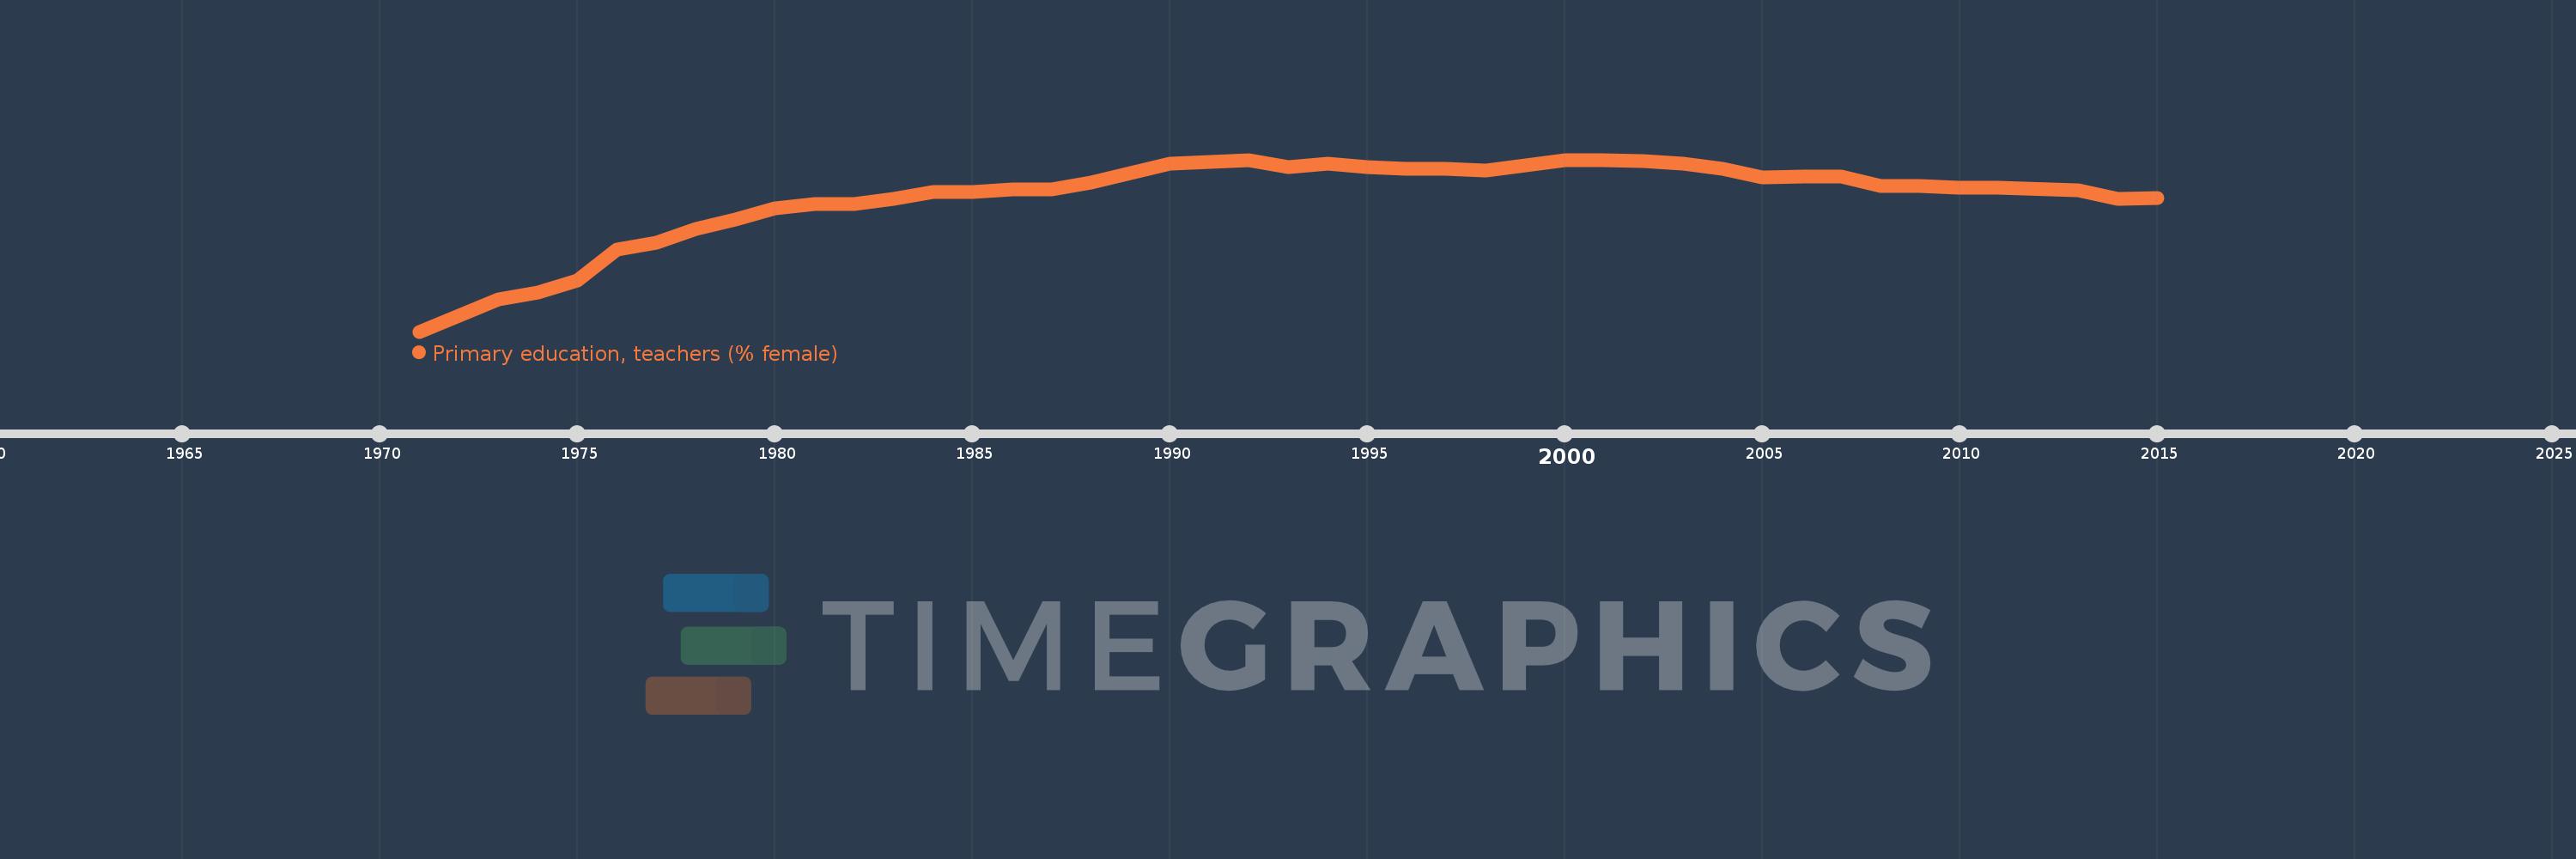
This timeline shows a graph from 1971 to 2015 of Lesotho. No data until 1970. Number of actual observations by date: 42.
Source name:
World Development Indicators
Source organization:
United Nations Educational, Scientific, and Cultural Organization (UNESCO) Institute for Statistics.
Categories, topics:
Education, Gender
Last updated:
apr 23, 2017
Indicators value changes by year
Minimum:
59.864
jan 1, 1971
Maximum:
80.182
jan 1, 2000
At the date of observation
Value
Absolute change
Change from previous value
jan 1, 1971
59.864
+59.864
0.0%
jan 1, 1973
63.694
+3.83
6.4%
jan 1, 1974
64.515
+0.821
1.29%
jan 1, 1975
65.934
+1.418
2.2%
jan 1, 1976
69.546
+3.612
5.48%
jan 1, 1977
70.423
+0.877
1.26%
jan 1, 1978
71.98
+1.557
2.21%
jan 1, 1979
73.128
+1.149
1.6%
jan 1, 1980
74.404
+1.276
1.74%
jan 1, 1981
74.907
+0.503
0.68%
jan 1, 1982
74.972
+0.065
0.09%
jan 1, 1983
75.581
+0.609
0.81%
jan 1, 1984
76.402
+0.821
1.09%
jan 1, 1985
76.363
-0.039
-0.05%
jan 1, 1986
76.691
+0.327
0.43%
jan 1, 1987
76.702
+0.011
0.01%
jan 1, 1988
77.466
+0.764
1.0%
jan 1, 1989
78.615
+1.149
1.48%
jan 1, 1990
79.681
+1.066
1.36%
jan 1, 1991
79.932
+0.25
0.31%
jan 1, 1992
80.18
+0.248
0.31%
jan 1, 1993
79.308
-0.872
-1.09%
jan 1, 1994
79.772
+0.464
0.59%
jan 1, 1995
79.268
-0.504
-0.63%
jan 1, 1996
79.137
-0.131
-0.17%
jan 1, 1997
79.121
-0.015
-0.02%
jan 1, 1998
78.922
-0.199
-0.25%
jan 1, 2000
80.182
+1.26
1.6%
jan 1, 2001
80.182
-0.001
0.0%
jan 1, 2002
80.073
-0.109
-0.14%
jan 1, 2003
79.76
-0.313
-0.39%
jan 1, 2004
79.137
-0.623
-0.78%
jan 1, 2005
78.115
-1.022
-1.29%
jan 1, 2006
78.196
+0.081
0.1%
jan 1, 2007
78.24
+0.044
0.06%
jan 1, 2008
77.074
-1.166
-1.49%
jan 1, 2009
77.073
-0.001
0.0%
jan 1, 2010
76.838
-0.235
-0.31%
jan 1, 2011
76.877
+0.039
0.05%
jan 1, 2013
76.598
-0.279
-0.36%
jan 1, 2014
75.6
-0.998
-1.3%
jan 1, 2015
75.669
+0.069
0.09%
Ranking of countries by current statistics by years


Comments: