29
/
en
AIzaSyAYiBZKx7MnpbEhh9jyipgxe19OcubqV5w
April 1, 2024
53745
Other small states
OSS
false
2
1
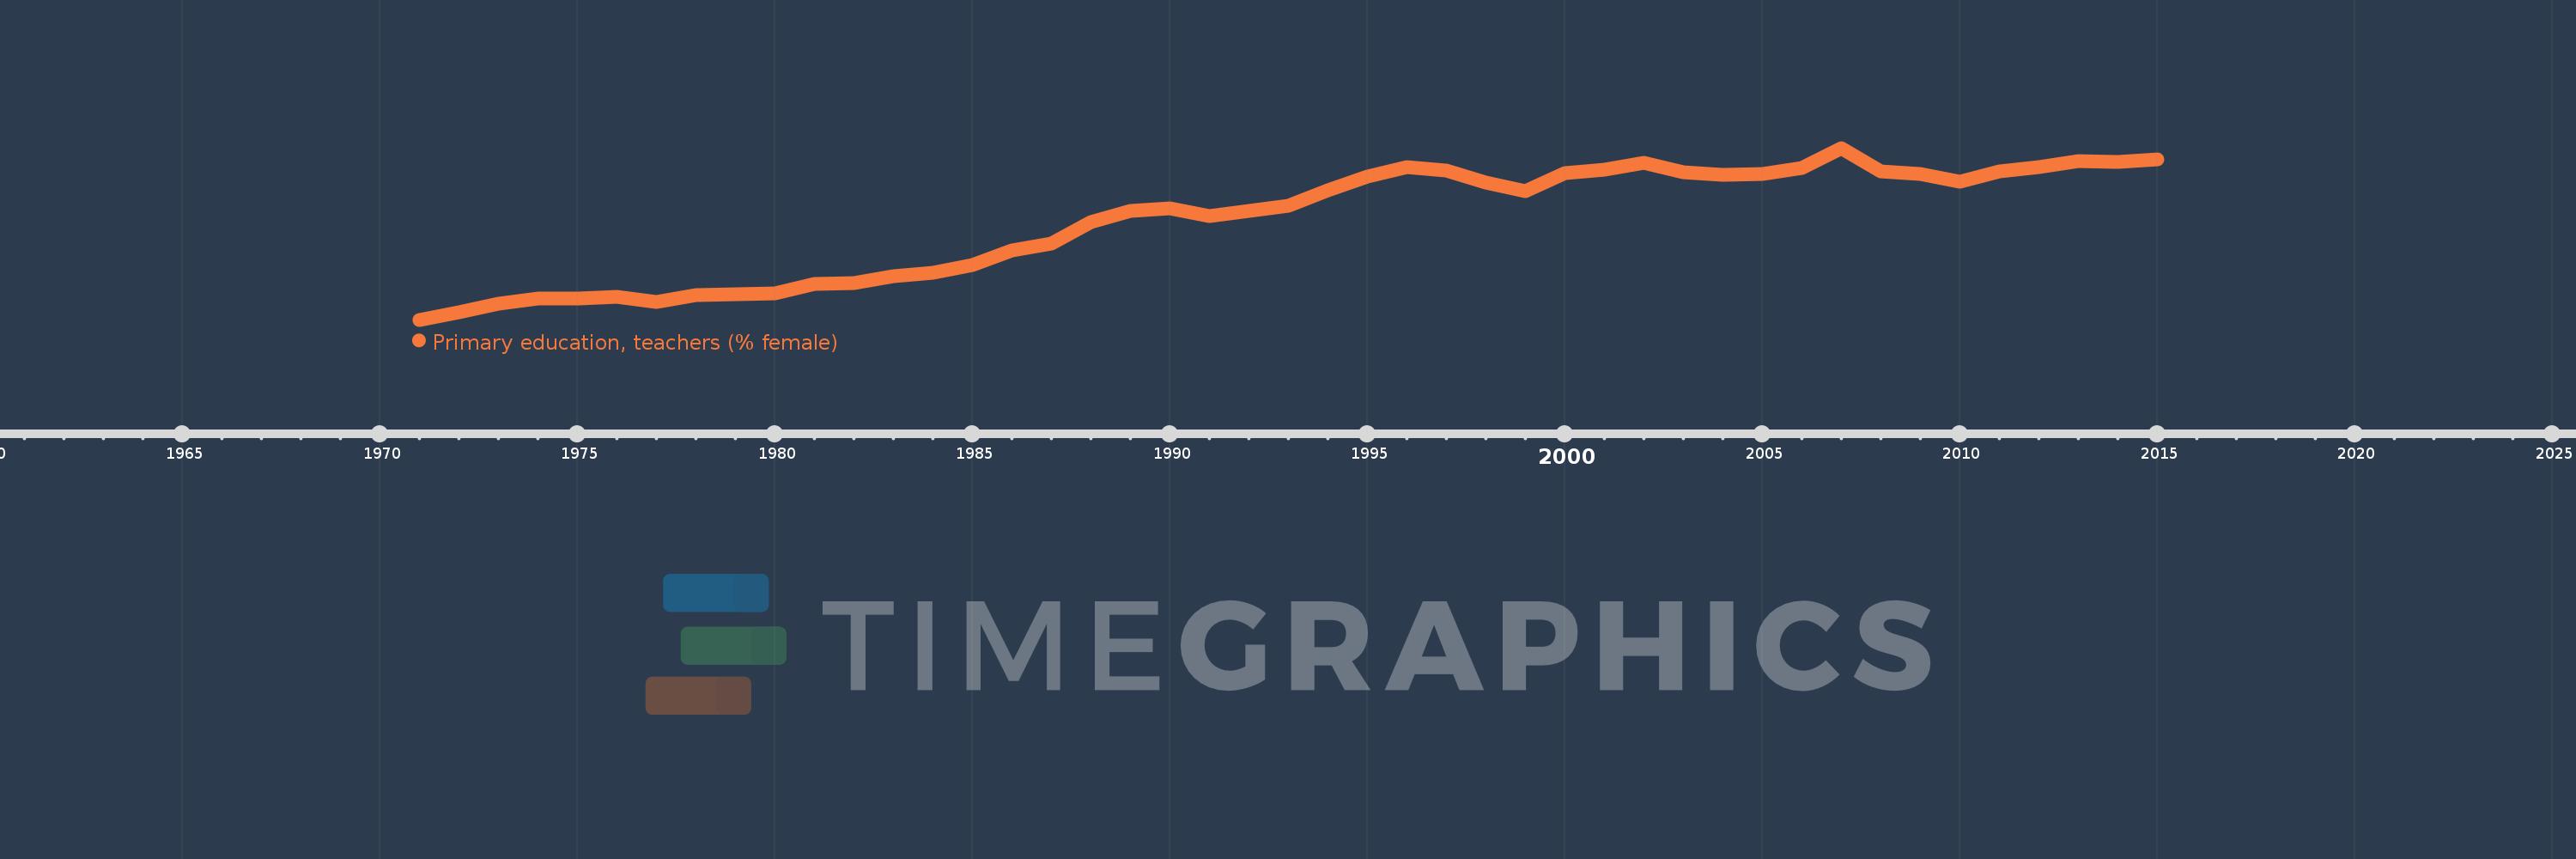
Primary education, teachers (% female)
2015,2014,2013,2012,2011,2010,2009,2008,2007,2006,2005,2004,2003,2002,2001,2000,1999,1998,1997,1996,1995,1994,1993,1992,1991,1990,1989,1988,1987,1986,1985,1984,1983,1982,1981,1980,1979,1978,1977,1976,1975,1974,1973,1972,1971
This statistics in other country:
AfghanistanAlbaniaAlgeriaAndorraAngolaAntigua and BarbudaArab WorldArgentinaArmeniaArubaAustraliaAustriaAzerbaijanBahamas, TheBahrainBangladeshBarbadosBelarusBelgiumBelizeBeninBermudaBhutanBoliviaBosnia and HerzegovinaBotswanaBrazilBritish Virgin IslandsBrunei DarussalamBulgariaBurkina FasoBurundiCabo VerdeCambodiaCameroonCanadaCaribbean small statesCayman IslandsCentral African RepublicCentral Europe and the BalticsChadChileChinaColombiaComorosCongo, Dem. Rep.Congo, Rep.Costa RicaCote d'IvoireCroatiaCubaCyprusCzech RepublicDenmarkDjiboutiDominicaDominican RepublicEarly-demographic dividendEast Asia & PacificEast Asia & Pacific (excluding high income)East Asia & Pacific (IDA & IBRD countries)EcuadorEgypt, Arab Rep.El SalvadorEquatorial GuineaEritreaEstoniaEthiopiaEuro areaEurope & Central AsiaEurope & Central Asia (excluding high income)Europe & Central Asia (IDA & IBRD countries)European UnionFijiFinlandFragile and conflict affected situationsFranceGabonGambia, TheGeorgiaGermanyGhanaGibraltarGreeceGrenadaGuatemalaGuineaGuinea-BissauGuyanaHaitiHeavily indebted poor countries (HIPC)High incomeHondurasHong Kong SAR, ChinaHungaryIBRD onlyIcelandIDA & IBRD totalIDA blendIDA onlyIDA totalIndiaIndonesiaIran, Islamic Rep.IraqIrelandIsraelItalyJamaicaJapanJordanKazakhstanKenyaKiribatiKorea, Dem. People’s Rep.Korea, Rep.KuwaitKyrgyz RepublicLao PDRLate-demographic dividendLatin America & Caribbean Latin America & Caribbean (excluding high income)Latin America & the Caribbean (IDA & IBRD countries)LatviaLeast developed countries: UN classificationLebanonLesothoLiberiaLibyaLiechtensteinLithuaniaLow & middle incomeLow incomeLower middle incomeLuxembourgMacao SAR, ChinaMacedonia, FYRMadagascarMalawiMalaysiaMaldivesMaliMaltaMarshall IslandsMauritaniaMauritiusMexicoMiddle East & North AfricaMiddle East & North Africa (excluding high income)Middle East & North Africa (IDA & IBRD countries)Middle incomeMoldovaMonacoMongoliaMoroccoMozambiqueMyanmarNamibiaNauruNepalNetherlandsNew ZealandNicaraguaNigerNigeriaNorth AmericaNorwayOECD membersOmanOther small statesPacific island small statesPakistanPalauPanamaPapua New GuineaParaguayPeruPhilippinesPolandPortugalPost-demographic dividendPre-demographic dividendPuerto RicoQatarRomaniaRussian FederationRwandaSamoaSan MarinoSao Tome and PrincipeSaudi ArabiaSenegalSerbiaSeychellesSierra LeoneSingaporeSint Maarten (Dutch part)Slovak RepublicSloveniaSmall statesSolomon IslandsSomaliaSouth AfricaSouth AsiaSouth Asia (IDA & IBRD)South SudanSpainSri LankaSt. Kitts and NevisSt. LuciaSt. Vincent and the GrenadinesSub-Saharan Africa Sub-Saharan Africa (excluding high income)Sub-Saharan Africa (IDA & IBRD countries)SudanSurinameSwazilandSwedenSwitzerlandSyrian Arab RepublicTajikistanTanzaniaThailandTimor-LesteTogoTongaTrinidad and TobagoTunisiaTurkeyTurks and Caicos IslandsTuvaluUgandaUkraineUnited Arab EmiratesUnited KingdomUnited StatesUpper middle incomeUruguayUzbekistanVanuatuVenezuela, RBVietnamWest Bank and GazaWorldYemen, Rep.ZambiaZimbabwe Timeline:
This timeline shows a graph from 1971 to 2015 of Other small states. No data until 1970. Number of actual observations by date: 45.
Source name:
World Development Indicators
Source organization:
United Nations Educational, Scientific, and Cultural Organization (UNESCO) Institute for Statistics.
Categories, topics:
Education, Gender
Last updated:
apr 23, 2017
Indicators value changes by year
Minimum:
57.258
jan 1, 1971
Maximum:
65.612
jan 1, 2007
At the date of observation
Value
Absolute change
Change from previous value
jan 1, 1971
57.258
+57.258
0.0%
jan 1, 1972
57.629
+0.37
0.65%
jan 1, 1973
58.046
+0.417
0.72%
jan 1, 1974
58.282
+0.236
0.41%
jan 1, 1975
58.272
-0.01
-0.02%
jan 1, 1976
58.373
+0.101
0.17%
jan 1, 1977
58.143
-0.229
-0.39%
jan 1, 1978
58.437
+0.293
0.5%
jan 1, 1979
58.481
+0.045
0.08%
jan 1, 1980
58.56
+0.079
0.13%
jan 1, 1981
59.011
+0.451
0.77%
jan 1, 1982
59.028
+0.017
0.03%
jan 1, 1983
59.377
+0.349
0.59%
jan 1, 1984
59.563
+0.186
0.31%
jan 1, 1985
59.914
+0.352
0.59%
jan 1, 1986
60.625
+0.711
1.19%
jan 1, 1987
60.946
+0.321
0.53%
jan 1, 1988
62.002
+1.056
1.73%
jan 1, 1989
62.54
+0.537
0.87%
jan 1, 1990
62.668
+0.128
0.21%
jan 1, 1991
62.283
-0.384
-0.61%
jan 1, 1992
62.547
+0.263
0.42%
jan 1, 1993
62.781
+0.235
0.38%
jan 1, 1994
63.565
+0.784
1.25%
jan 1, 1995
64.208
+0.642
1.01%
jan 1, 1996
64.692
+0.485
0.75%
jan 1, 1997
64.513
-0.179
-0.28%
jan 1, 1998
63.909
-0.605
-0.94%
jan 1, 1999
63.506
-0.402
-0.63%
jan 1, 2000
64.404
+0.898
1.41%
jan 1, 2001
64.544
+0.14
0.22%
jan 1, 2002
64.881
+0.337
0.52%
jan 1, 2003
64.412
-0.47
-0.72%
jan 1, 2004
64.287
-0.125
-0.19%
jan 1, 2005
64.35
+0.063
0.1%
jan 1, 2006
64.645
+0.295
0.46%
jan 1, 2007
65.612
+0.967
1.5%
jan 1, 2008
64.49
-1.122
-1.71%
jan 1, 2009
64.355
-0.135
-0.21%
jan 1, 2010
63.977
-0.378
-0.59%
jan 1, 2011
64.456
+0.479
0.75%
jan 1, 2012
64.697
+0.241
0.37%
jan 1, 2013
64.98
+0.282
0.44%
jan 1, 2014
64.927
-0.053
-0.08%
jan 1, 2015
65.038
+0.112
0.17%
Ranking of countries by current statistics by years


Comments: