29
/
en
AIzaSyAYiBZKx7MnpbEhh9jyipgxe19OcubqV5w
April 1, 2024
74314
Austria
AUT
true
2
1
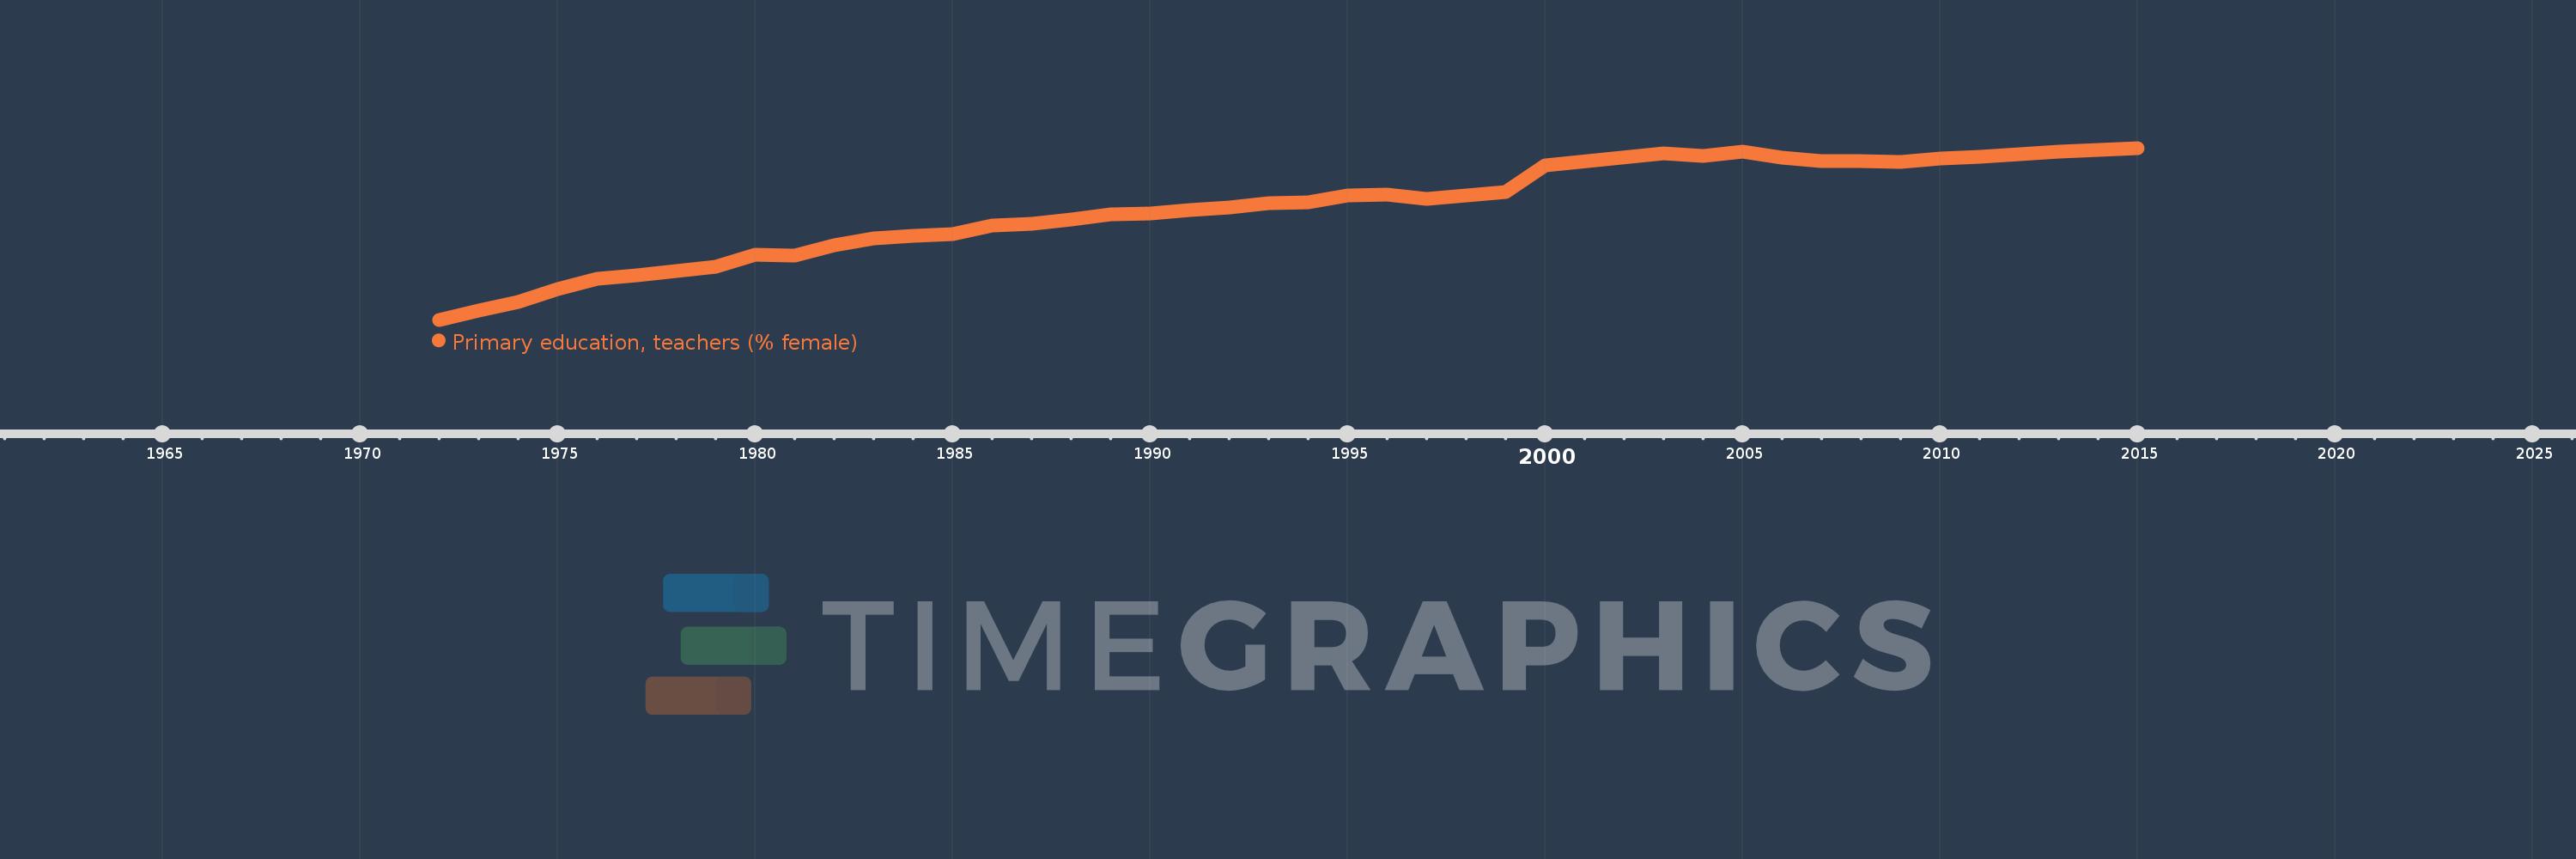
Primary education, teachers (% female)
2015,2014,2013,2012,2011,2010,2009,2008,2007,2006,2005,2004,2003,2000,1999,1998,1997,1996,1995,1994,1993,1992,1991,1990,1989,1988,1987,1986,1985,1984,1983,1982,1981,1980,1979,1977,1976,1975,1974,1973,1972
This statistics in other country:
AfghanistanAlbaniaAlgeriaAndorraAngolaAntigua and BarbudaArab WorldArgentinaArmeniaArubaAustraliaAustriaAzerbaijanBahamas, TheBahrainBangladeshBarbadosBelarusBelgiumBelizeBeninBermudaBhutanBoliviaBosnia and HerzegovinaBotswanaBrazilBritish Virgin IslandsBrunei DarussalamBulgariaBurkina FasoBurundiCabo VerdeCambodiaCameroonCanadaCaribbean small statesCayman IslandsCentral African RepublicCentral Europe and the BalticsChadChileChinaColombiaComorosCongo, Dem. Rep.Congo, Rep.Costa RicaCote d'IvoireCroatiaCubaCyprusCzech RepublicDenmarkDjiboutiDominicaDominican RepublicEarly-demographic dividendEast Asia & PacificEast Asia & Pacific (excluding high income)East Asia & Pacific (IDA & IBRD countries)EcuadorEgypt, Arab Rep.El SalvadorEquatorial GuineaEritreaEstoniaEthiopiaEuro areaEurope & Central AsiaEurope & Central Asia (excluding high income)Europe & Central Asia (IDA & IBRD countries)European UnionFijiFinlandFragile and conflict affected situationsFranceGabonGambia, TheGeorgiaGermanyGhanaGibraltarGreeceGrenadaGuatemalaGuineaGuinea-BissauGuyanaHaitiHeavily indebted poor countries (HIPC)High incomeHondurasHong Kong SAR, ChinaHungaryIBRD onlyIcelandIDA & IBRD totalIDA blendIDA onlyIDA totalIndiaIndonesiaIran, Islamic Rep.IraqIrelandIsraelItalyJamaicaJapanJordanKazakhstanKenyaKiribatiKorea, Dem. People’s Rep.Korea, Rep.KuwaitKyrgyz RepublicLao PDRLate-demographic dividendLatin America & Caribbean Latin America & Caribbean (excluding high income)Latin America & the Caribbean (IDA & IBRD countries)LatviaLeast developed countries: UN classificationLebanonLesothoLiberiaLibyaLiechtensteinLithuaniaLow & middle incomeLow incomeLower middle incomeLuxembourgMacao SAR, ChinaMacedonia, FYRMadagascarMalawiMalaysiaMaldivesMaliMaltaMarshall IslandsMauritaniaMauritiusMexicoMiddle East & North AfricaMiddle East & North Africa (excluding high income)Middle East & North Africa (IDA & IBRD countries)Middle incomeMoldovaMonacoMongoliaMoroccoMozambiqueMyanmarNamibiaNauruNepalNetherlandsNew ZealandNicaraguaNigerNigeriaNorth AmericaNorwayOECD membersOmanOther small statesPacific island small statesPakistanPalauPanamaPapua New GuineaParaguayPeruPhilippinesPolandPortugalPost-demographic dividendPre-demographic dividendPuerto RicoQatarRomaniaRussian FederationRwandaSamoaSan MarinoSao Tome and PrincipeSaudi ArabiaSenegalSerbiaSeychellesSierra LeoneSingaporeSint Maarten (Dutch part)Slovak RepublicSloveniaSmall statesSolomon IslandsSomaliaSouth AfricaSouth AsiaSouth Asia (IDA & IBRD)South SudanSpainSri LankaSt. Kitts and NevisSt. LuciaSt. Vincent and the GrenadinesSub-Saharan Africa Sub-Saharan Africa (excluding high income)Sub-Saharan Africa (IDA & IBRD countries)SudanSurinameSwazilandSwedenSwitzerlandSyrian Arab RepublicTajikistanTanzaniaThailandTimor-LesteTogoTongaTrinidad and TobagoTunisiaTurkeyTurks and Caicos IslandsTuvaluUgandaUkraineUnited Arab EmiratesUnited KingdomUnited StatesUpper middle incomeUruguayUzbekistanVanuatuVenezuela, RBVietnamWest Bank and GazaWorldYemen, Rep.ZambiaZimbabwe Timeline:
This timeline shows a graph from 1972 to 2015 of Austria. No data until 1971. Number of actual observations by date: 41.
Source name:
World Development Indicators
Source organization:
United Nations Educational, Scientific, and Cultural Organization (UNESCO) Institute for Statistics.
Categories, topics:
Education, Gender
Last updated:
apr 23, 2017
Indicators value changes by year
Minimum:
63.304
jan 1, 1972
Maximum:
91.437
jan 1, 2015
At the date of observation
Value
Absolute change
Change from previous value
jan 1, 1972
63.304
+63.304
0.0%
jan 1, 1973
64.851
+1.546
2.44%
jan 1, 1974
66.233
+1.383
2.13%
jan 1, 1975
68.262
+2.029
3.06%
jan 1, 1976
70.006
+1.744
2.55%
jan 1, 1977
70.554
+0.549
0.78%
jan 1, 1979
72.003
+1.448
2.05%
jan 1, 1980
73.98
+1.977
2.75%
jan 1, 1981
73.806
-0.173
-0.23%
jan 1, 1982
75.48
+1.674
2.27%
jan 1, 1983
76.594
+1.113
1.47%
jan 1, 1984
77.087
+0.493
0.64%
jan 1, 1985
77.264
+0.177
0.23%
jan 1, 1986
78.705
+1.441
1.86%
jan 1, 1987
78.946
+0.241
0.31%
jan 1, 1988
79.743
+0.797
1.01%
jan 1, 1989
80.63
+0.887
1.11%
jan 1, 1990
80.738
+0.108
0.13%
jan 1, 1991
81.252
+0.515
0.64%
jan 1, 1992
81.722
+0.47
0.58%
jan 1, 1993
82.422
+0.7
0.86%
jan 1, 1994
82.553
+0.131
0.16%
jan 1, 1995
83.714
+1.161
1.41%
jan 1, 1996
83.86
+0.146
0.17%
jan 1, 1997
83.028
-0.832
-0.99%
jan 1, 1998
83.594
+0.566
0.68%
jan 1, 1999
84.178
+0.584
0.7%
jan 1, 2000
88.543
+4.364
5.18%
jan 1, 2003
90.535
+1.992
2.25%
jan 1, 2004
90.108
-0.427
-0.47%
jan 1, 2005
90.9
+0.792
0.88%
jan 1, 2006
89.808
-1.092
-1.2%
jan 1, 2007
89.247
-0.561
-0.62%
jan 1, 2008
89.332
+0.084
0.09%
jan 1, 2009
89.193
-0.139
-0.16%
jan 1, 2010
89.643
+0.451
0.51%
jan 1, 2011
89.988
+0.344
0.38%
jan 1, 2012
90.393
+0.405
0.45%
jan 1, 2013
90.869
+0.476
0.53%
jan 1, 2014
91.11
+0.241
0.27%
jan 1, 2015
91.437
+0.327
0.36%
Ranking of countries by current statistics by years


Comments: