29
/
en
AIzaSyAYiBZKx7MnpbEhh9jyipgxe19OcubqV5w
April 1, 2024
43814
Latin America & the Caribbean (IDA & IBRD countries)
TLA
false
2
1
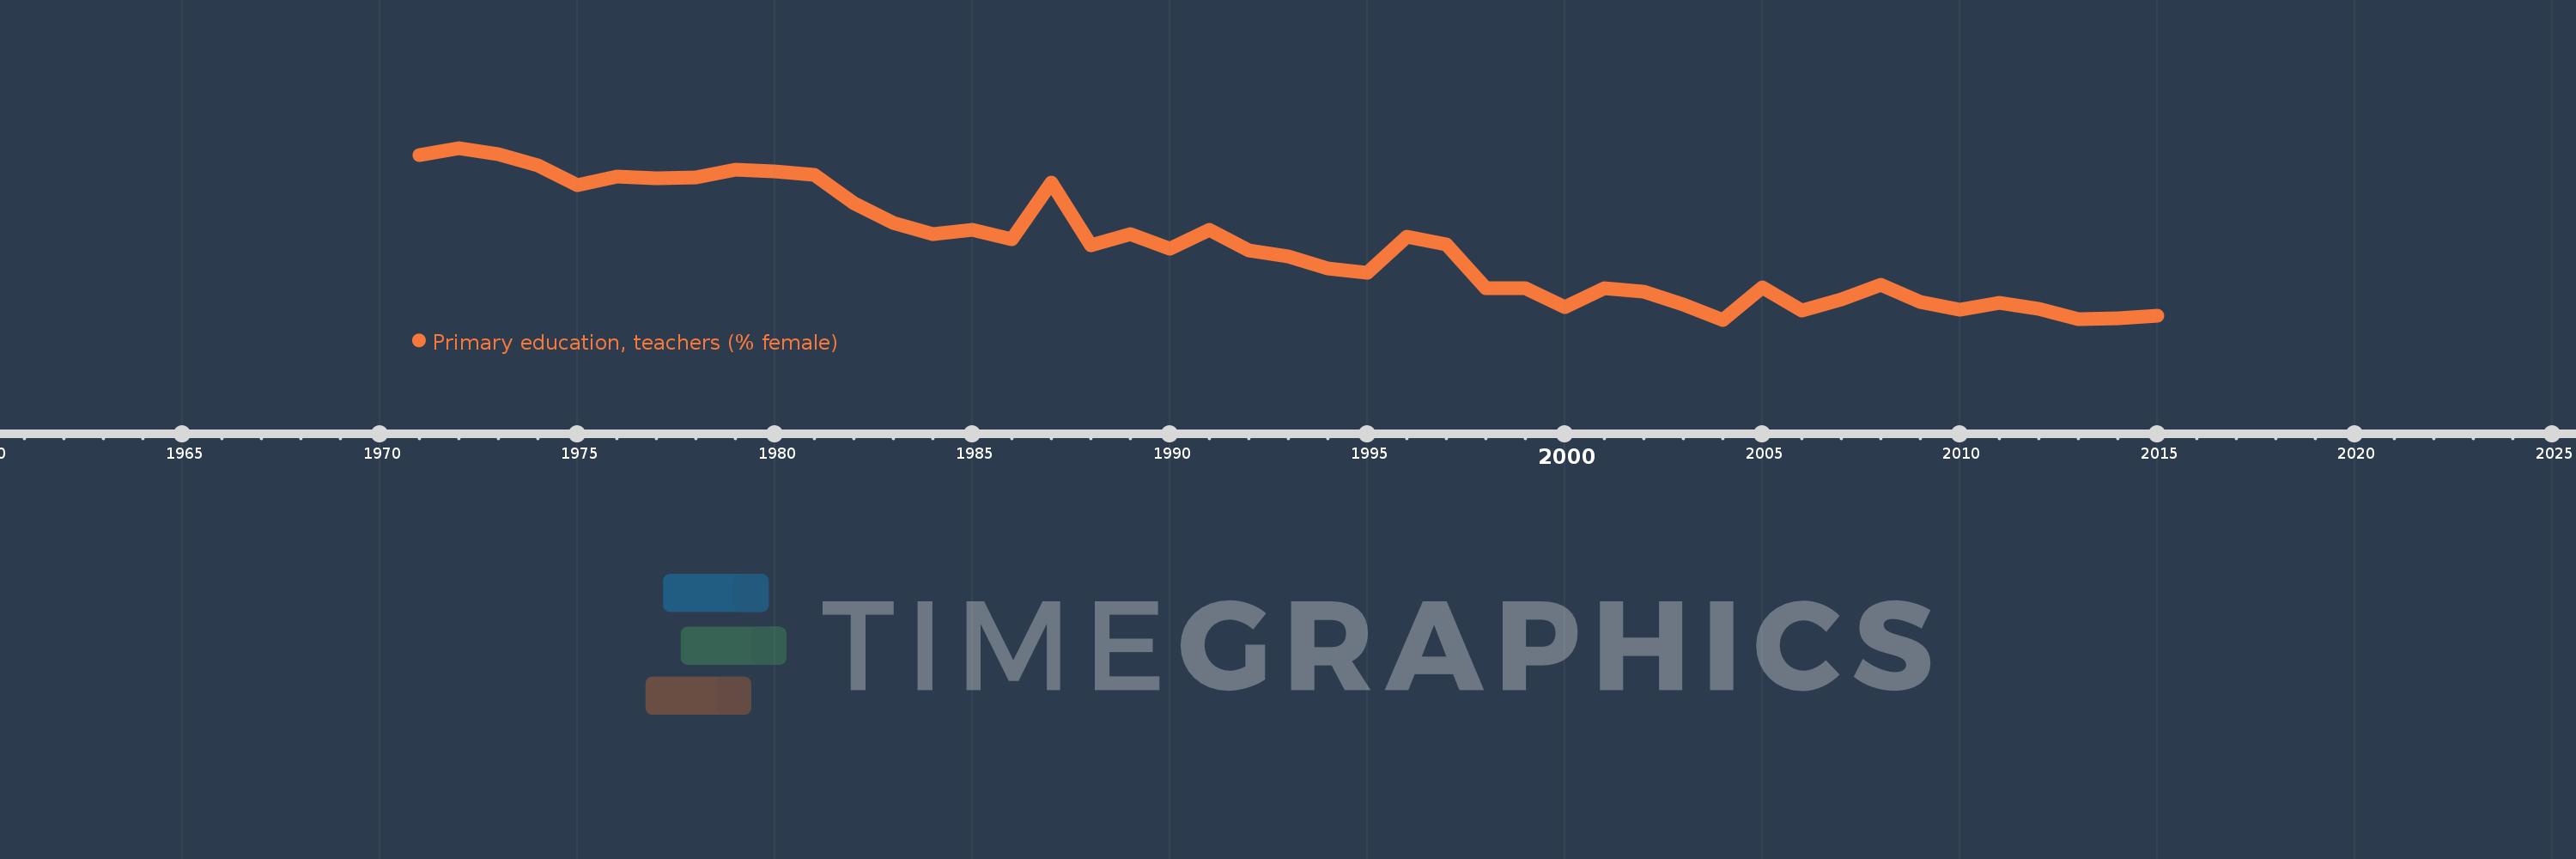
Primary education, teachers (% female)
2015,2014,2013,2012,2011,2010,2009,2008,2007,2006,2005,2004,2003,2002,2001,2000,1999,1998,1997,1996,1995,1994,1993,1992,1991,1990,1989,1988,1987,1986,1985,1984,1983,1982,1981,1980,1979,1978,1977,1976,1975,1974,1973,1972,1971
This statistics in other country:
AfghanistanAlbaniaAlgeriaAndorraAngolaAntigua and BarbudaArab WorldArgentinaArmeniaArubaAustraliaAustriaAzerbaijanBahamas, TheBahrainBangladeshBarbadosBelarusBelgiumBelizeBeninBermudaBhutanBoliviaBosnia and HerzegovinaBotswanaBrazilBritish Virgin IslandsBrunei DarussalamBulgariaBurkina FasoBurundiCabo VerdeCambodiaCameroonCanadaCaribbean small statesCayman IslandsCentral African RepublicCentral Europe and the BalticsChadChileChinaColombiaComorosCongo, Dem. Rep.Congo, Rep.Costa RicaCote d'IvoireCroatiaCubaCyprusCzech RepublicDenmarkDjiboutiDominicaDominican RepublicEarly-demographic dividendEast Asia & PacificEast Asia & Pacific (excluding high income)East Asia & Pacific (IDA & IBRD countries)EcuadorEgypt, Arab Rep.El SalvadorEquatorial GuineaEritreaEstoniaEthiopiaEuro areaEurope & Central AsiaEurope & Central Asia (excluding high income)Europe & Central Asia (IDA & IBRD countries)European UnionFijiFinlandFragile and conflict affected situationsFranceGabonGambia, TheGeorgiaGermanyGhanaGibraltarGreeceGrenadaGuatemalaGuineaGuinea-BissauGuyanaHaitiHeavily indebted poor countries (HIPC)High incomeHondurasHong Kong SAR, ChinaHungaryIBRD onlyIcelandIDA & IBRD totalIDA blendIDA onlyIDA totalIndiaIndonesiaIran, Islamic Rep.IraqIrelandIsraelItalyJamaicaJapanJordanKazakhstanKenyaKiribatiKorea, Dem. People’s Rep.Korea, Rep.KuwaitKyrgyz RepublicLao PDRLate-demographic dividendLatin America & Caribbean Latin America & Caribbean (excluding high income)Latin America & the Caribbean (IDA & IBRD countries)LatviaLeast developed countries: UN classificationLebanonLesothoLiberiaLibyaLiechtensteinLithuaniaLow & middle incomeLow incomeLower middle incomeLuxembourgMacao SAR, ChinaMacedonia, FYRMadagascarMalawiMalaysiaMaldivesMaliMaltaMarshall IslandsMauritaniaMauritiusMexicoMiddle East & North AfricaMiddle East & North Africa (excluding high income)Middle East & North Africa (IDA & IBRD countries)Middle incomeMoldovaMonacoMongoliaMoroccoMozambiqueMyanmarNamibiaNauruNepalNetherlandsNew ZealandNicaraguaNigerNigeriaNorth AmericaNorwayOECD membersOmanOther small statesPacific island small statesPakistanPalauPanamaPapua New GuineaParaguayPeruPhilippinesPolandPortugalPost-demographic dividendPre-demographic dividendPuerto RicoQatarRomaniaRussian FederationRwandaSamoaSan MarinoSao Tome and PrincipeSaudi ArabiaSenegalSerbiaSeychellesSierra LeoneSingaporeSint Maarten (Dutch part)Slovak RepublicSloveniaSmall statesSolomon IslandsSomaliaSouth AfricaSouth AsiaSouth Asia (IDA & IBRD)South SudanSpainSri LankaSt. Kitts and NevisSt. LuciaSt. Vincent and the GrenadinesSub-Saharan Africa Sub-Saharan Africa (excluding high income)Sub-Saharan Africa (IDA & IBRD countries)SudanSurinameSwazilandSwedenSwitzerlandSyrian Arab RepublicTajikistanTanzaniaThailandTimor-LesteTogoTongaTrinidad and TobagoTunisiaTurkeyTurks and Caicos IslandsTuvaluUgandaUkraineUnited Arab EmiratesUnited KingdomUnited StatesUpper middle incomeUruguayUzbekistanVanuatuVenezuela, RBVietnamWest Bank and GazaWorldYemen, Rep.ZambiaZimbabwe Timeline:
This timeline shows a graph from 1971 to 2015 of Latin America & the Caribbean (IDA & IBRD countries). No data until 1970. Number of actual observations by date: 45.
Source name:
World Development Indicators
Source organization:
United Nations Educational, Scientific, and Cultural Organization (UNESCO) Institute for Statistics.
Categories, topics:
Education, Gender
Last updated:
apr 23, 2017
Indicators value changes by year
Minimum:
77.245
jan 1, 2004
Maximum:
80.909
jan 1, 1972
At the date of observation
Value
Absolute change
Change from previous value
jan 1, 1971
80.752
+80.752
0.0%
jan 1, 1972
80.909
+0.158
0.2%
jan 1, 1973
80.777
-0.132
-0.16%
jan 1, 1974
80.53
-0.247
-0.31%
jan 1, 1975
80.112
-0.419
-0.52%
jan 1, 1976
80.308
+0.197
0.25%
jan 1, 1977
80.262
-0.046
-0.06%
jan 1, 1978
80.281
+0.019
0.02%
jan 1, 1979
80.447
+0.166
0.21%
jan 1, 1980
80.401
-0.046
-0.06%
jan 1, 1981
80.34
-0.061
-0.08%
jan 1, 1982
79.733
-0.607
-0.76%
jan 1, 1983
79.31
-0.423
-0.53%
jan 1, 1984
79.063
-0.247
-0.31%
jan 1, 1985
79.163
+0.1
0.13%
jan 1, 1986
78.955
-0.208
-0.26%
jan 1, 1987
80.165
+1.21
1.53%
jan 1, 1988
78.832
-1.333
-1.66%
jan 1, 1989
79.066
+0.235
0.3%
jan 1, 1990
78.759
-0.308
-0.39%
jan 1, 1991
79.156
+0.397
0.5%
jan 1, 1992
78.725
-0.431
-0.54%
jan 1, 1993
78.6
-0.125
-0.16%
jan 1, 1994
78.34
-0.259
-0.33%
jan 1, 1995
78.253
-0.087
-0.11%
jan 1, 1996
79.011
+0.758
0.97%
jan 1, 1997
78.846
-0.165
-0.21%
jan 1, 1998
77.915
-0.931
-1.18%
jan 1, 1999
77.909
-0.006
-0.01%
jan 1, 2000
77.513
-0.396
-0.51%
jan 1, 2001
77.914
+0.4
0.52%
jan 1, 2002
77.845
-0.068
-0.09%
jan 1, 2003
77.566
-0.279
-0.36%
jan 1, 2004
77.245
-0.321
-0.41%
jan 1, 2005
77.93
+0.686
0.89%
jan 1, 2006
77.447
-0.484
-0.62%
jan 1, 2007
77.684
+0.237
0.31%
jan 1, 2008
77.989
+0.305
0.39%
jan 1, 2009
77.631
-0.358
-0.46%
jan 1, 2010
77.459
-0.172
-0.22%
jan 1, 2011
77.611
+0.153
0.2%
jan 1, 2012
77.48
-0.131
-0.17%
jan 1, 2013
77.257
-0.223
-0.29%
jan 1, 2014
77.267
+0.01
0.01%
jan 1, 2015
77.324
+0.057
0.07%
Ranking of countries by current statistics by years


Comments: