29
/
en
AIzaSyAYiBZKx7MnpbEhh9jyipgxe19OcubqV5w
April 1, 2024
172141
Kuwait
KWT
true
2
1
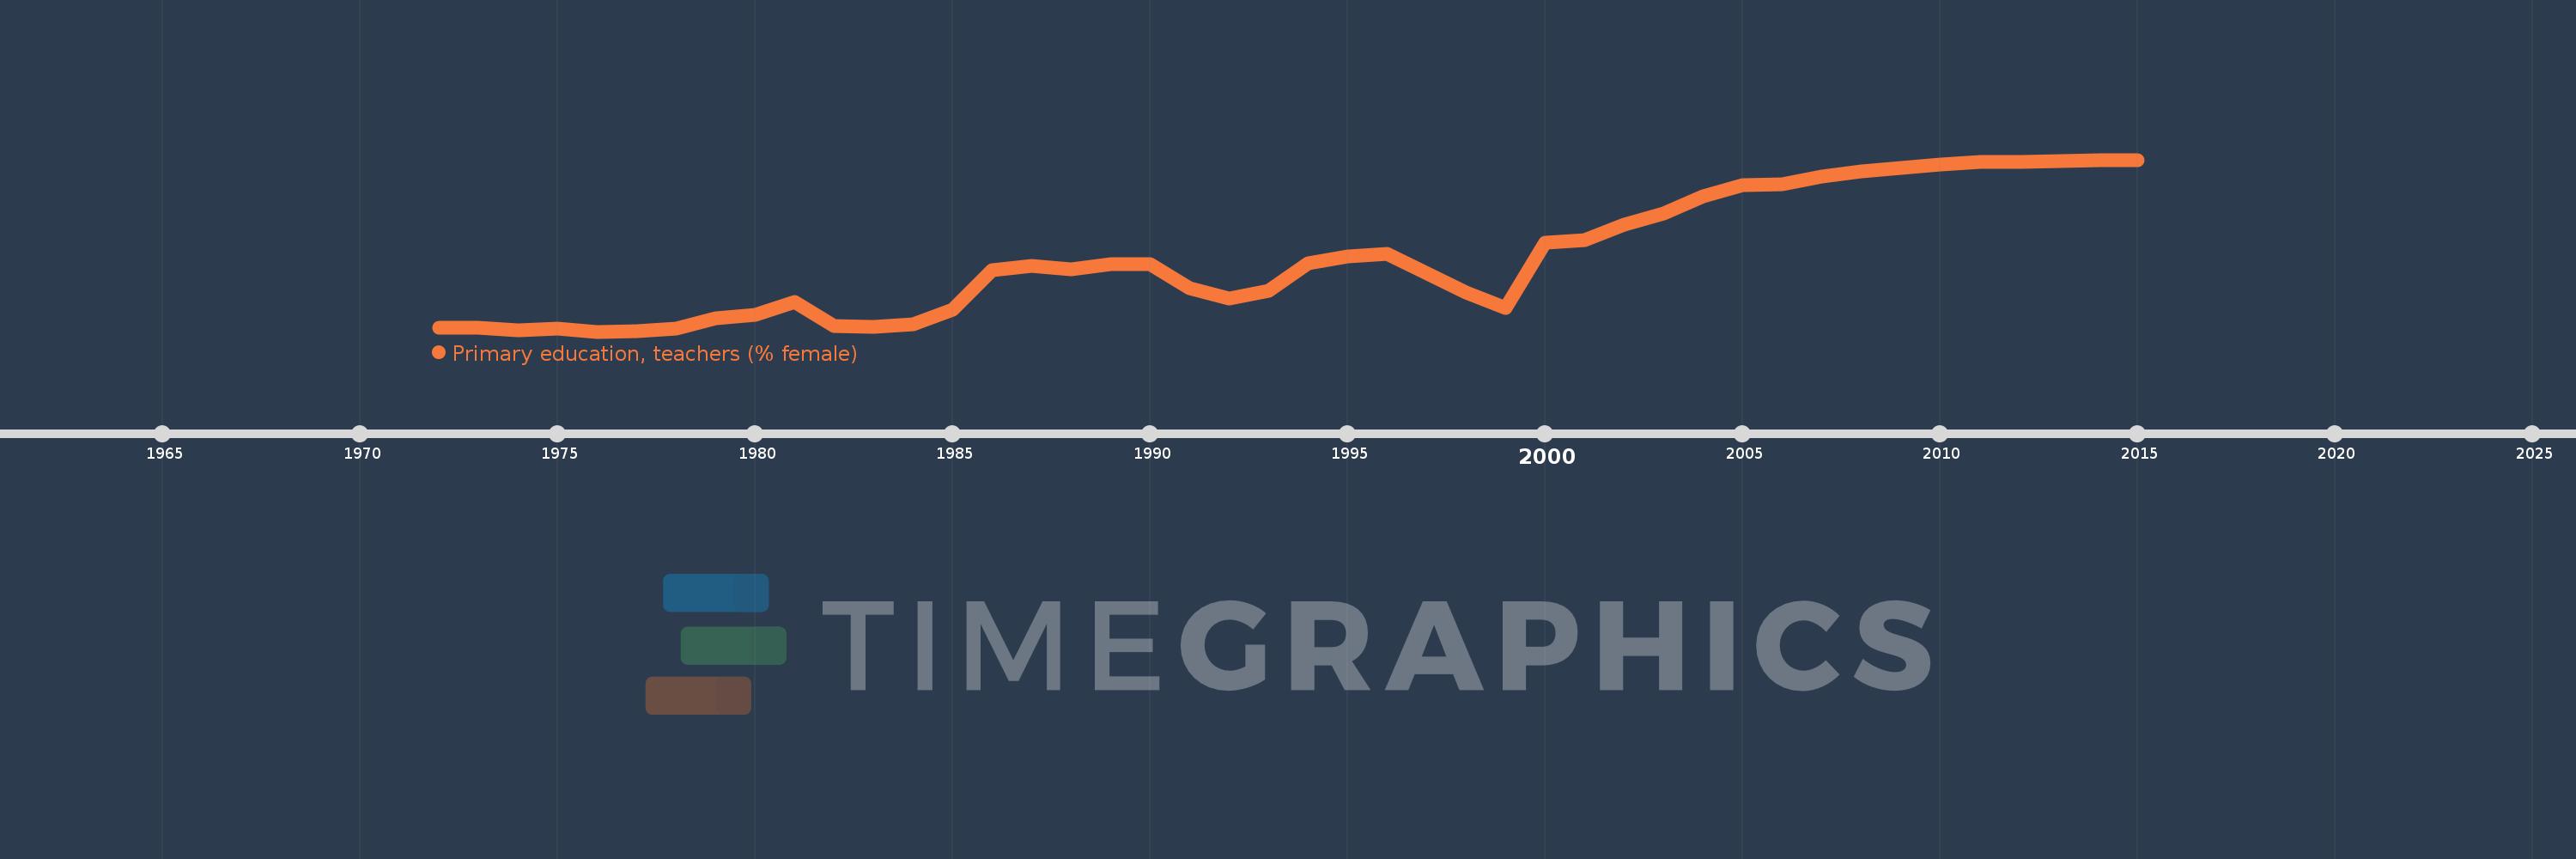
Primary education, teachers (% female)
2015,2014,2013,2012,2011,2010,2009,2008,2007,2006,2005,2004,2003,2002,2001,2000,1999,1998,1996,1995,1994,1993,1992,1991,1990,1989,1988,1987,1986,1985,1984,1983,1982,1981,1980,1979,1978,1977,1976,1975,1974,1973,1972
This statistics in other country:
AfghanistanAlbaniaAlgeriaAndorraAngolaAntigua and BarbudaArab WorldArgentinaArmeniaArubaAustraliaAustriaAzerbaijanBahamas, TheBahrainBangladeshBarbadosBelarusBelgiumBelizeBeninBermudaBhutanBoliviaBosnia and HerzegovinaBotswanaBrazilBritish Virgin IslandsBrunei DarussalamBulgariaBurkina FasoBurundiCabo VerdeCambodiaCameroonCanadaCaribbean small statesCayman IslandsCentral African RepublicCentral Europe and the BalticsChadChileChinaColombiaComorosCongo, Dem. Rep.Congo, Rep.Costa RicaCote d'IvoireCroatiaCubaCyprusCzech RepublicDenmarkDjiboutiDominicaDominican RepublicEarly-demographic dividendEast Asia & PacificEast Asia & Pacific (excluding high income)East Asia & Pacific (IDA & IBRD countries)EcuadorEgypt, Arab Rep.El SalvadorEquatorial GuineaEritreaEstoniaEthiopiaEuro areaEurope & Central AsiaEurope & Central Asia (excluding high income)Europe & Central Asia (IDA & IBRD countries)European UnionFijiFinlandFragile and conflict affected situationsFranceGabonGambia, TheGeorgiaGermanyGhanaGibraltarGreeceGrenadaGuatemalaGuineaGuinea-BissauGuyanaHaitiHeavily indebted poor countries (HIPC)High incomeHondurasHong Kong SAR, ChinaHungaryIBRD onlyIcelandIDA & IBRD totalIDA blendIDA onlyIDA totalIndiaIndonesiaIran, Islamic Rep.IraqIrelandIsraelItalyJamaicaJapanJordanKazakhstanKenyaKiribatiKorea, Dem. People’s Rep.Korea, Rep.KuwaitKyrgyz RepublicLao PDRLate-demographic dividendLatin America & Caribbean Latin America & Caribbean (excluding high income)Latin America & the Caribbean (IDA & IBRD countries)LatviaLeast developed countries: UN classificationLebanonLesothoLiberiaLibyaLiechtensteinLithuaniaLow & middle incomeLow incomeLower middle incomeLuxembourgMacao SAR, ChinaMacedonia, FYRMadagascarMalawiMalaysiaMaldivesMaliMaltaMarshall IslandsMauritaniaMauritiusMexicoMiddle East & North AfricaMiddle East & North Africa (excluding high income)Middle East & North Africa (IDA & IBRD countries)Middle incomeMoldovaMonacoMongoliaMoroccoMozambiqueMyanmarNamibiaNauruNepalNetherlandsNew ZealandNicaraguaNigerNigeriaNorth AmericaNorwayOECD membersOmanOther small statesPacific island small statesPakistanPalauPanamaPapua New GuineaParaguayPeruPhilippinesPolandPortugalPost-demographic dividendPre-demographic dividendPuerto RicoQatarRomaniaRussian FederationRwandaSamoaSan MarinoSao Tome and PrincipeSaudi ArabiaSenegalSerbiaSeychellesSierra LeoneSingaporeSint Maarten (Dutch part)Slovak RepublicSloveniaSmall statesSolomon IslandsSomaliaSouth AfricaSouth AsiaSouth Asia (IDA & IBRD)South SudanSpainSri LankaSt. Kitts and NevisSt. LuciaSt. Vincent and the GrenadinesSub-Saharan Africa Sub-Saharan Africa (excluding high income)Sub-Saharan Africa (IDA & IBRD countries)SudanSurinameSwazilandSwedenSwitzerlandSyrian Arab RepublicTajikistanTanzaniaThailandTimor-LesteTogoTongaTrinidad and TobagoTunisiaTurkeyTurks and Caicos IslandsTuvaluUgandaUkraineUnited Arab EmiratesUnited KingdomUnited StatesUpper middle incomeUruguayUzbekistanVanuatuVenezuela, RBVietnamWest Bank and GazaWorldYemen, Rep.ZambiaZimbabwe Timeline:
This timeline shows a graph from 1972 to 2015 of Kuwait. No data until 1971. Number of actual observations by date: 43.
Source name:
World Development Indicators
Source organization:
United Nations Educational, Scientific, and Cultural Organization (UNESCO) Institute for Statistics.
Categories, topics:
Education, Gender
Last updated:
apr 23, 2017
Indicators value changes by year
Minimum:
54.442
jan 1, 1976
Maximum:
90.895
jan 1, 2015
At the date of observation
Value
Absolute change
Change from previous value
jan 1, 1972
55.331
+55.331
0.0%
jan 1, 1973
55.191
-0.14
-0.25%
jan 1, 1974
54.782
-0.409
-0.74%
jan 1, 1975
55.116
+0.334
0.61%
jan 1, 1976
54.442
-0.673
-1.22%
jan 1, 1977
54.575
+0.133
0.24%
jan 1, 1978
55.083
+0.508
0.93%
jan 1, 1979
57.247
+2.164
3.93%
jan 1, 1980
58.085
+0.837
1.46%
jan 1, 1981
60.71
+2.625
4.52%
jan 1, 1982
55.582
-5.128
-8.45%
jan 1, 1983
55.432
-0.15
-0.27%
jan 1, 1984
56.039
+0.606
1.09%
jan 1, 1985
59.132
+3.094
5.52%
jan 1, 1986
67.432
+8.3
14.04%
jan 1, 1987
68.44
+1.008
1.49%
jan 1, 1988
67.678
-0.762
-1.11%
jan 1, 1989
68.819
+1.141
1.69%
jan 1, 1990
68.828
+0.009
0.01%
jan 1, 1991
63.598
-5.229
-7.6%
jan 1, 1992
61.43
-2.168
-3.41%
jan 1, 1993
63.169
+1.739
2.83%
jan 1, 1994
68.921
+5.752
9.11%
jan 1, 1995
70.47
+1.549
2.25%
jan 1, 1996
70.934
+0.464
0.66%
jan 1, 1998
62.711
-8.223
-11.59%
jan 1, 1999
59.4
-3.311
-5.28%
jan 1, 2000
73.299
+13.899
23.4%
jan 1, 2001
73.909
+0.611
0.83%
jan 1, 2002
77.052
+3.143
4.25%
jan 1, 2003
79.424
+2.372
3.08%
jan 1, 2004
83.146
+3.722
4.69%
jan 1, 2005
85.504
+2.358
2.84%
jan 1, 2006
85.751
+0.246
0.29%
jan 1, 2007
87.4
+1.649
1.92%
jan 1, 2008
88.431
+1.031
1.18%
jan 1, 2009
89.203
+0.772
0.87%
jan 1, 2010
89.803
+0.6
0.67%
jan 1, 2011
90.408
+0.605
0.67%
jan 1, 2012
90.436
+0.029
0.03%
jan 1, 2013
90.644
+0.208
0.23%
jan 1, 2014
90.835
+0.191
0.21%
jan 1, 2015
90.895
+0.06
0.07%
Ranking of countries by current statistics by years


Comments: