29
/
en
AIzaSyAYiBZKx7MnpbEhh9jyipgxe19OcubqV5w
April 1, 2024
55098
Post-demographic dividend
PST
false
2
1
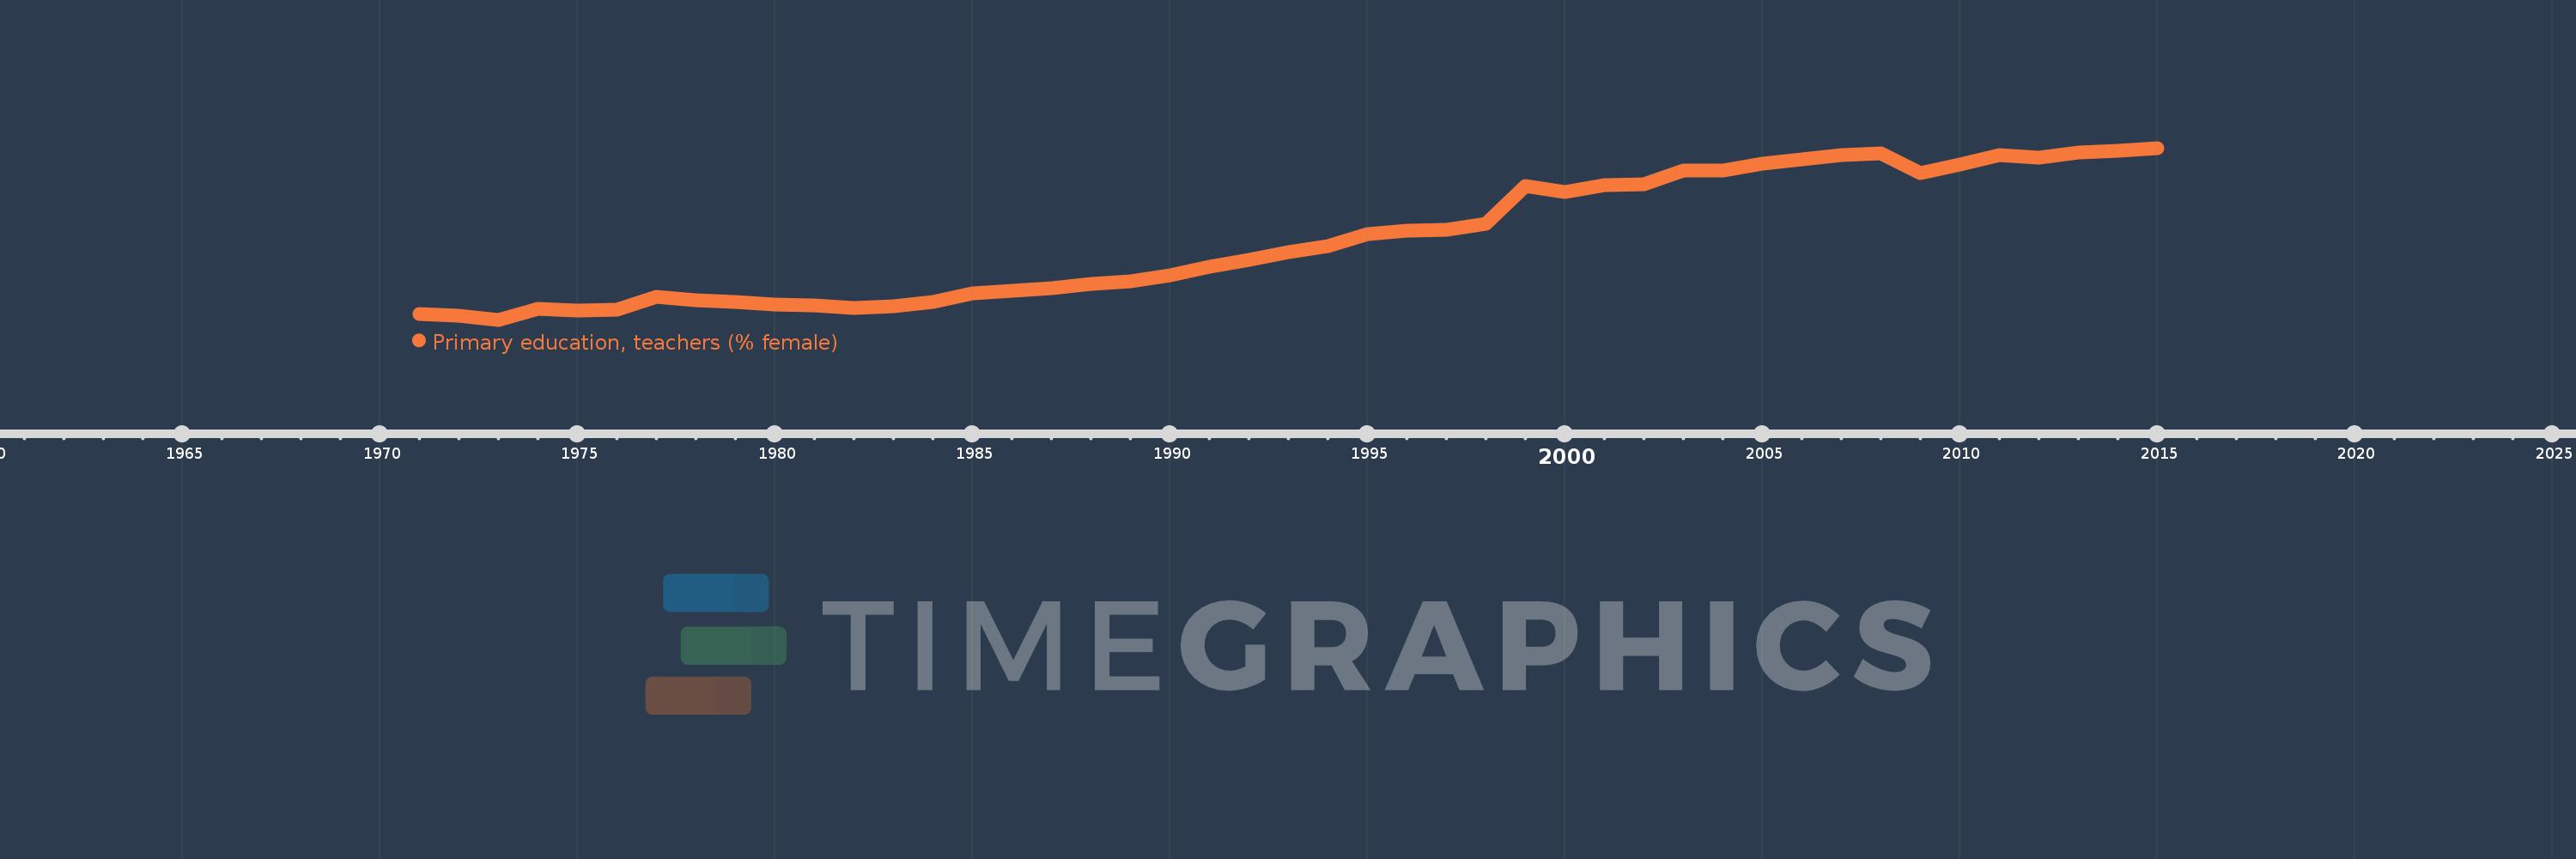
Primary education, teachers (% female)
2015,2014,2013,2012,2011,2010,2009,2008,2007,2006,2005,2004,2003,2002,2001,2000,1999,1998,1997,1996,1995,1994,1993,1992,1991,1990,1989,1988,1987,1986,1985,1984,1983,1982,1981,1980,1979,1978,1977,1976,1975,1974,1973,1972,1971
This statistics in other country:
AfghanistanAlbaniaAlgeriaAndorraAngolaAntigua and BarbudaArab WorldArgentinaArmeniaArubaAustraliaAustriaAzerbaijanBahamas, TheBahrainBangladeshBarbadosBelarusBelgiumBelizeBeninBermudaBhutanBoliviaBosnia and HerzegovinaBotswanaBrazilBritish Virgin IslandsBrunei DarussalamBulgariaBurkina FasoBurundiCabo VerdeCambodiaCameroonCanadaCaribbean small statesCayman IslandsCentral African RepublicCentral Europe and the BalticsChadChileChinaColombiaComorosCongo, Dem. Rep.Congo, Rep.Costa RicaCote d'IvoireCroatiaCubaCyprusCzech RepublicDenmarkDjiboutiDominicaDominican RepublicEarly-demographic dividendEast Asia & PacificEast Asia & Pacific (excluding high income)East Asia & Pacific (IDA & IBRD countries)EcuadorEgypt, Arab Rep.El SalvadorEquatorial GuineaEritreaEstoniaEthiopiaEuro areaEurope & Central AsiaEurope & Central Asia (excluding high income)Europe & Central Asia (IDA & IBRD countries)European UnionFijiFinlandFragile and conflict affected situationsFranceGabonGambia, TheGeorgiaGermanyGhanaGibraltarGreeceGrenadaGuatemalaGuineaGuinea-BissauGuyanaHaitiHeavily indebted poor countries (HIPC)High incomeHondurasHong Kong SAR, ChinaHungaryIBRD onlyIcelandIDA & IBRD totalIDA blendIDA onlyIDA totalIndiaIndonesiaIran, Islamic Rep.IraqIrelandIsraelItalyJamaicaJapanJordanKazakhstanKenyaKiribatiKorea, Dem. People’s Rep.Korea, Rep.KuwaitKyrgyz RepublicLao PDRLate-demographic dividendLatin America & Caribbean Latin America & Caribbean (excluding high income)Latin America & the Caribbean (IDA & IBRD countries)LatviaLeast developed countries: UN classificationLebanonLesothoLiberiaLibyaLiechtensteinLithuaniaLow & middle incomeLow incomeLower middle incomeLuxembourgMacao SAR, ChinaMacedonia, FYRMadagascarMalawiMalaysiaMaldivesMaliMaltaMarshall IslandsMauritaniaMauritiusMexicoMiddle East & North AfricaMiddle East & North Africa (excluding high income)Middle East & North Africa (IDA & IBRD countries)Middle incomeMoldovaMonacoMongoliaMoroccoMozambiqueMyanmarNamibiaNauruNepalNetherlandsNew ZealandNicaraguaNigerNigeriaNorth AmericaNorwayOECD membersOmanOther small statesPacific island small statesPakistanPalauPanamaPapua New GuineaParaguayPeruPhilippinesPolandPortugalPost-demographic dividendPre-demographic dividendPuerto RicoQatarRomaniaRussian FederationRwandaSamoaSan MarinoSao Tome and PrincipeSaudi ArabiaSenegalSerbiaSeychellesSierra LeoneSingaporeSint Maarten (Dutch part)Slovak RepublicSloveniaSmall statesSolomon IslandsSomaliaSouth AfricaSouth AsiaSouth Asia (IDA & IBRD)South SudanSpainSri LankaSt. Kitts and NevisSt. LuciaSt. Vincent and the GrenadinesSub-Saharan Africa Sub-Saharan Africa (excluding high income)Sub-Saharan Africa (IDA & IBRD countries)SudanSurinameSwazilandSwedenSwitzerlandSyrian Arab RepublicTajikistanTanzaniaThailandTimor-LesteTogoTongaTrinidad and TobagoTunisiaTurkeyTurks and Caicos IslandsTuvaluUgandaUkraineUnited Arab EmiratesUnited KingdomUnited StatesUpper middle incomeUruguayUzbekistanVanuatuVenezuela, RBVietnamWest Bank and GazaWorldYemen, Rep.ZambiaZimbabwe Timeline:
This timeline shows a graph from 1971 to 2015 of Post-demographic dividend. No data until 1970. Number of actual observations by date: 45.
Source name:
World Development Indicators
Source organization:
United Nations Educational, Scientific, and Cultural Organization (UNESCO) Institute for Statistics.
Categories, topics:
Education, Gender
Last updated:
apr 23, 2017
Indicators value changes by year
Minimum:
75.592
jan 1, 1973
Maximum:
83.137
jan 1, 2015
At the date of observation
Value
Absolute change
Change from previous value
jan 1, 1971
75.839
+75.839
0.0%
jan 1, 1972
75.765
-0.074
-0.1%
jan 1, 1973
75.592
-0.173
-0.23%
jan 1, 1974
76.068
+0.476
0.63%
jan 1, 1975
76.006
-0.062
-0.08%
jan 1, 1976
76.024
+0.018
0.02%
jan 1, 1977
76.591
+0.567
0.75%
jan 1, 1978
76.442
-0.149
-0.19%
jan 1, 1979
76.369
-0.072
-0.09%
jan 1, 1980
76.269
-0.1
-0.13%
jan 1, 1981
76.216
-0.053
-0.07%
jan 1, 1982
76.099
-0.117
-0.15%
jan 1, 1983
76.167
+0.068
0.09%
jan 1, 1984
76.381
+0.215
0.28%
jan 1, 1985
76.743
+0.361
0.47%
jan 1, 1986
76.864
+0.121
0.16%
jan 1, 1987
76.98
+0.116
0.15%
jan 1, 1988
77.158
+0.178
0.23%
jan 1, 1989
77.29
+0.132
0.17%
jan 1, 1990
77.541
+0.25
0.32%
jan 1, 1991
77.903
+0.363
0.47%
jan 1, 1992
78.21
+0.306
0.39%
jan 1, 1993
78.561
+0.351
0.45%
jan 1, 1994
78.81
+0.249
0.32%
jan 1, 1995
79.357
+0.547
0.69%
jan 1, 1996
79.5
+0.144
0.18%
jan 1, 1997
79.553
+0.053
0.07%
jan 1, 1998
79.794
+0.241
0.3%
jan 1, 1999
81.455
+1.66
2.08%
jan 1, 2000
81.204
-0.251
-0.31%
jan 1, 2001
81.489
+0.285
0.35%
jan 1, 2002
81.55
+0.061
0.08%
jan 1, 2003
82.152
+0.602
0.74%
jan 1, 2004
82.13
-0.022
-0.03%
jan 1, 2005
82.444
+0.314
0.38%
jan 1, 2006
82.624
+0.18
0.22%
jan 1, 2007
82.818
+0.194
0.24%
jan 1, 2008
82.903
+0.085
0.1%
jan 1, 2009
82.041
-0.862
-1.04%
jan 1, 2010
82.393
+0.352
0.43%
jan 1, 2011
82.821
+0.427
0.52%
jan 1, 2012
82.726
-0.095
-0.11%
jan 1, 2013
82.939
+0.213
0.26%
jan 1, 2014
83.026
+0.088
0.11%
jan 1, 2015
83.137
+0.111
0.13%
Ranking of countries by current statistics by years


Comments: