29
/
en
AIzaSyAYiBZKx7MnpbEhh9jyipgxe19OcubqV5w
April 1, 2024
134518
France
FRA
true
2
1
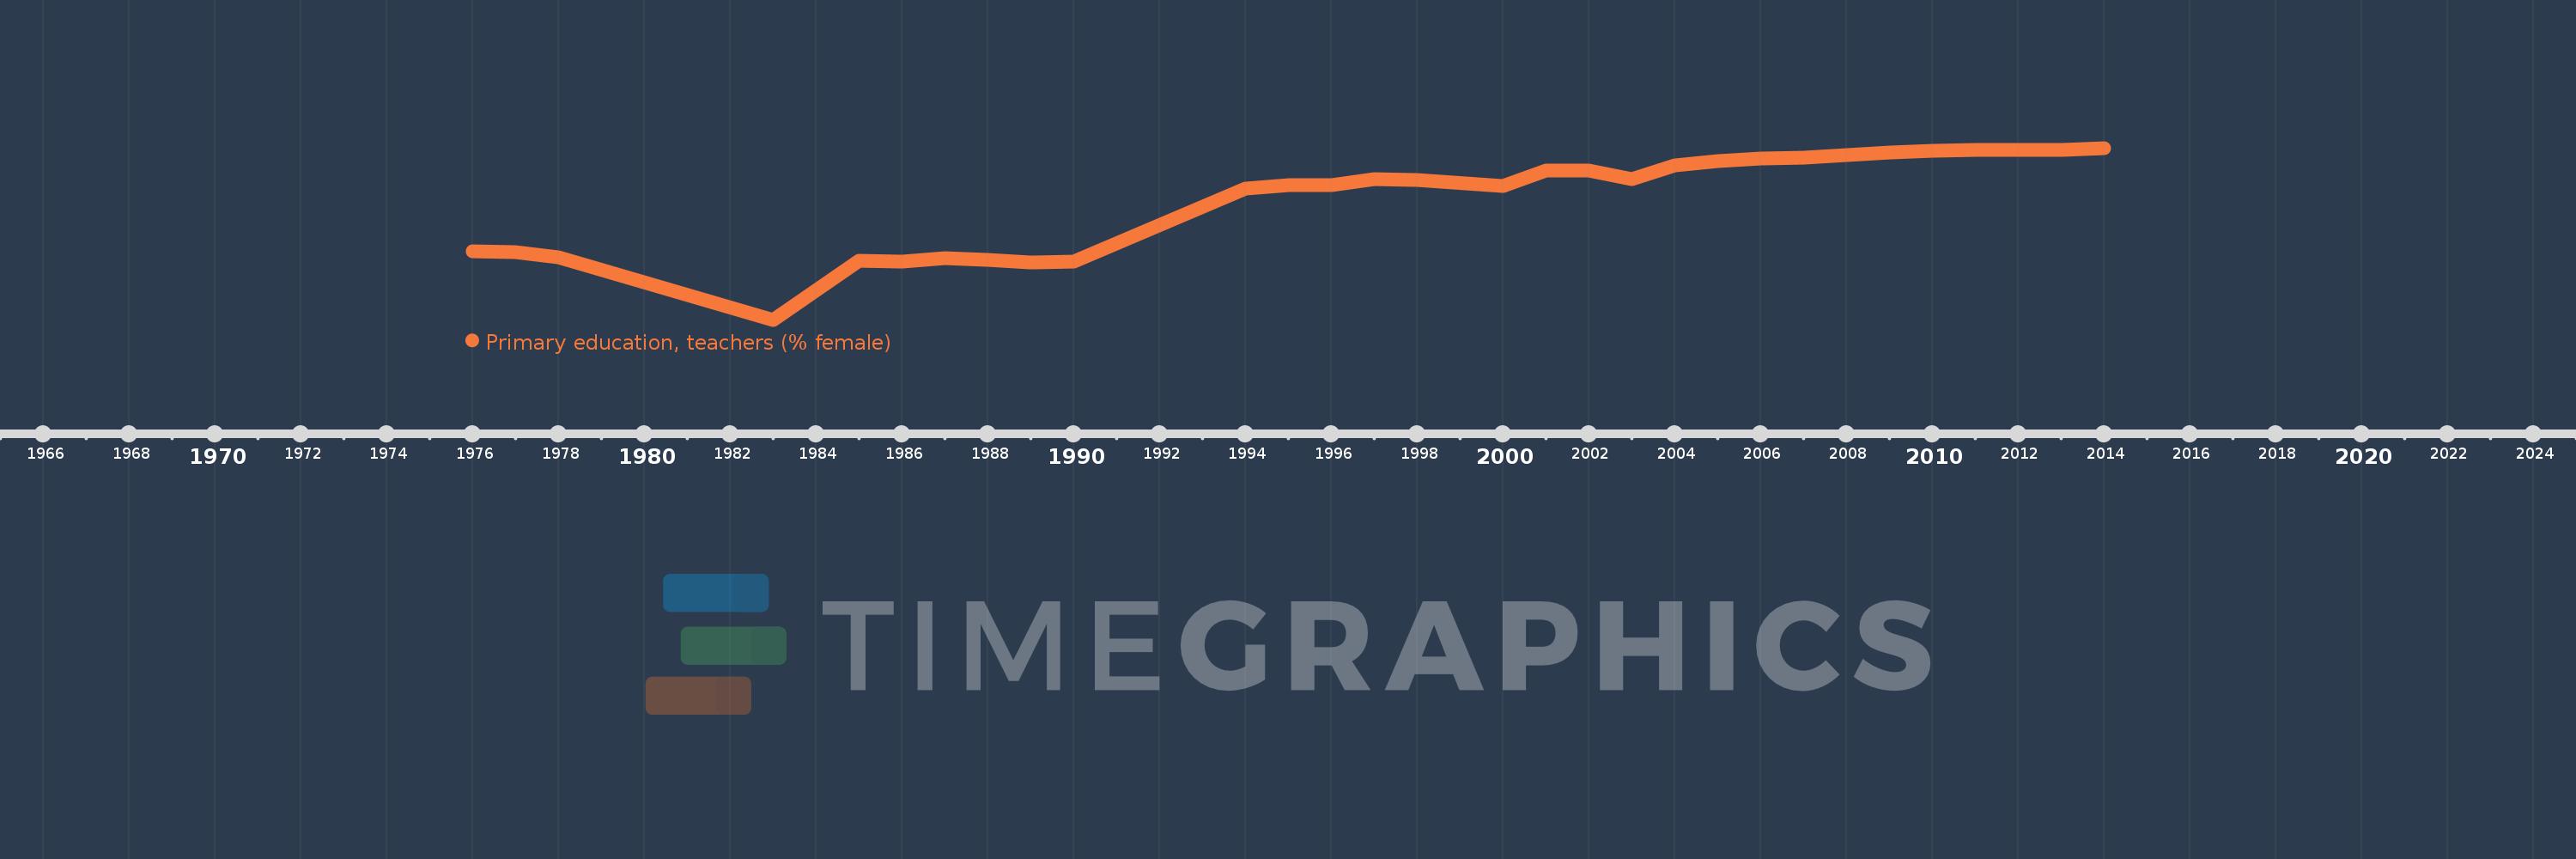
Primary education, teachers (% female)
2014,2013,2012,2011,2010,2009,2008,2007,2006,2005,2004,2003,2002,2001,2000,1998,1997,1996,1995,1994,1990,1989,1988,1987,1986,1985,1983,1978,1977,1976
This statistics in other country:
AfghanistanAlbaniaAlgeriaAndorraAngolaAntigua and BarbudaArab WorldArgentinaArmeniaArubaAustraliaAustriaAzerbaijanBahamas, TheBahrainBangladeshBarbadosBelarusBelgiumBelizeBeninBermudaBhutanBoliviaBosnia and HerzegovinaBotswanaBrazilBritish Virgin IslandsBrunei DarussalamBulgariaBurkina FasoBurundiCabo VerdeCambodiaCameroonCanadaCaribbean small statesCayman IslandsCentral African RepublicCentral Europe and the BalticsChadChileChinaColombiaComorosCongo, Dem. Rep.Congo, Rep.Costa RicaCote d'IvoireCroatiaCubaCyprusCzech RepublicDenmarkDjiboutiDominicaDominican RepublicEarly-demographic dividendEast Asia & PacificEast Asia & Pacific (excluding high income)East Asia & Pacific (IDA & IBRD countries)EcuadorEgypt, Arab Rep.El SalvadorEquatorial GuineaEritreaEstoniaEthiopiaEuro areaEurope & Central AsiaEurope & Central Asia (excluding high income)Europe & Central Asia (IDA & IBRD countries)European UnionFijiFinlandFragile and conflict affected situationsFranceGabonGambia, TheGeorgiaGermanyGhanaGibraltarGreeceGrenadaGuatemalaGuineaGuinea-BissauGuyanaHaitiHeavily indebted poor countries (HIPC)High incomeHondurasHong Kong SAR, ChinaHungaryIBRD onlyIcelandIDA & IBRD totalIDA blendIDA onlyIDA totalIndiaIndonesiaIran, Islamic Rep.IraqIrelandIsraelItalyJamaicaJapanJordanKazakhstanKenyaKiribatiKorea, Dem. People’s Rep.Korea, Rep.KuwaitKyrgyz RepublicLao PDRLate-demographic dividendLatin America & Caribbean Latin America & Caribbean (excluding high income)Latin America & the Caribbean (IDA & IBRD countries)LatviaLeast developed countries: UN classificationLebanonLesothoLiberiaLibyaLiechtensteinLithuaniaLow & middle incomeLow incomeLower middle incomeLuxembourgMacao SAR, ChinaMacedonia, FYRMadagascarMalawiMalaysiaMaldivesMaliMaltaMarshall IslandsMauritaniaMauritiusMexicoMiddle East & North AfricaMiddle East & North Africa (excluding high income)Middle East & North Africa (IDA & IBRD countries)Middle incomeMoldovaMonacoMongoliaMoroccoMozambiqueMyanmarNamibiaNauruNepalNetherlandsNew ZealandNicaraguaNigerNigeriaNorth AmericaNorwayOECD membersOmanOther small statesPacific island small statesPakistanPalauPanamaPapua New GuineaParaguayPeruPhilippinesPolandPortugalPost-demographic dividendPre-demographic dividendPuerto RicoQatarRomaniaRussian FederationRwandaSamoaSan MarinoSao Tome and PrincipeSaudi ArabiaSenegalSerbiaSeychellesSierra LeoneSingaporeSint Maarten (Dutch part)Slovak RepublicSloveniaSmall statesSolomon IslandsSomaliaSouth AfricaSouth AsiaSouth Asia (IDA & IBRD)South SudanSpainSri LankaSt. Kitts and NevisSt. LuciaSt. Vincent and the GrenadinesSub-Saharan Africa Sub-Saharan Africa (excluding high income)Sub-Saharan Africa (IDA & IBRD countries)SudanSurinameSwazilandSwedenSwitzerlandSyrian Arab RepublicTajikistanTanzaniaThailandTimor-LesteTogoTongaTrinidad and TobagoTunisiaTurkeyTurks and Caicos IslandsTuvaluUgandaUkraineUnited Arab EmiratesUnited KingdomUnited StatesUpper middle incomeUruguayUzbekistanVanuatuVenezuela, RBVietnamWest Bank and GazaWorldYemen, Rep.ZambiaZimbabwe Timeline:
This timeline shows a graph from 1976 to 2014 of France. No data until 1975. Number of actual observations by date: 30.
Source name:
World Development Indicators
Source organization:
United Nations Educational, Scientific, and Cultural Organization (UNESCO) Institute for Statistics.
Categories, topics:
Education, Gender
Last updated:
apr 23, 2017
Indicators value changes by year
Minimum:
59.036
jan 1, 1983
Maximum:
83.036
jan 1, 2014
At the date of observation
Value
Absolute change
Change from previous value
jan 1, 1976
68.568
+68.568
0.0%
jan 1, 1977
68.463
-0.105
-0.15%
jan 1, 1978
67.813
-0.649
-0.95%
jan 1, 1983
59.036
-8.777
-12.94%
jan 1, 1985
67.333
+8.297
14.05%
jan 1, 1986
67.101
-0.232
-0.35%
jan 1, 1987
67.593
+0.492
0.73%
jan 1, 1988
67.43
-0.163
-0.24%
jan 1, 1989
66.981
-0.449
-0.67%
jan 1, 1990
67.215
+0.234
0.35%
jan 1, 1994
77.358
+10.143
15.09%
jan 1, 1995
77.85
+0.492
0.64%
jan 1, 1996
77.874
+0.024
0.03%
jan 1, 1997
78.67
+0.796
1.02%
jan 1, 1998
78.619
-0.051
-0.06%
jan 1, 2000
77.719
-0.9
-1.14%
jan 1, 2001
79.841
+2.121
2.73%
jan 1, 2002
79.841
+0.0
0.0%
jan 1, 2003
78.684
-1.157
-1.45%
jan 1, 2004
80.621
+1.937
2.46%
jan 1, 2005
81.203
+0.582
0.72%
jan 1, 2006
81.55
+0.347
0.43%
jan 1, 2007
81.739
+0.188
0.23%
jan 1, 2008
82.087
+0.348
0.43%
jan 1, 2009
82.362
+0.275
0.34%
jan 1, 2010
82.596
+0.234
0.28%
jan 1, 2011
82.768
+0.172
0.21%
jan 1, 2012
82.718
-0.05
-0.06%
jan 1, 2013
82.812
+0.094
0.11%
jan 1, 2014
83.036
+0.225
0.27%
Ranking of countries by current statistics by years


Comments: