29
/
en
AIzaSyAYiBZKx7MnpbEhh9jyipgxe19OcubqV5w
April 1, 2024
227811
Qatar
QAT
true
2
1
Primary education, teachers (% female)
2015,2014,2013,2012,2011,2010,2009,2008,2007,2004,2003,2002,2000,1999,1997,1996,1995,1994,1993,1992,1991,1990,1989,1988,1987,1986,1985,1984,1983,1982,1981,1980,1979,1978,1977,1976,1975,1974,1973,1972
This statistics in other country:
AfghanistanAlbaniaAlgeriaAndorraAngolaAntigua and BarbudaArab WorldArgentinaArmeniaArubaAustraliaAustriaAzerbaijanBahamas, TheBahrainBangladeshBarbadosBelarusBelgiumBelizeBeninBermudaBhutanBoliviaBosnia and HerzegovinaBotswanaBrazilBritish Virgin IslandsBrunei DarussalamBulgariaBurkina FasoBurundiCabo VerdeCambodiaCameroonCanadaCaribbean small statesCayman IslandsCentral African RepublicCentral Europe and the BalticsChadChileChinaColombiaComorosCongo, Dem. Rep.Congo, Rep.Costa RicaCote d'IvoireCroatiaCubaCyprusCzech RepublicDenmarkDjiboutiDominicaDominican RepublicEarly-demographic dividendEast Asia & PacificEast Asia & Pacific (excluding high income)East Asia & Pacific (IDA & IBRD countries)EcuadorEgypt, Arab Rep.El SalvadorEquatorial GuineaEritreaEstoniaEthiopiaEuro areaEurope & Central AsiaEurope & Central Asia (excluding high income)Europe & Central Asia (IDA & IBRD countries)European UnionFijiFinlandFragile and conflict affected situationsFranceGabonGambia, TheGeorgiaGermanyGhanaGibraltarGreeceGrenadaGuatemalaGuineaGuinea-BissauGuyanaHaitiHeavily indebted poor countries (HIPC)High incomeHondurasHong Kong SAR, ChinaHungaryIBRD onlyIcelandIDA & IBRD totalIDA blendIDA onlyIDA totalIndiaIndonesiaIran, Islamic Rep.IraqIrelandIsraelItalyJamaicaJapanJordanKazakhstanKenyaKiribatiKorea, Dem. People’s Rep.Korea, Rep.KuwaitKyrgyz RepublicLao PDRLate-demographic dividendLatin America & Caribbean Latin America & Caribbean (excluding high income)Latin America & the Caribbean (IDA & IBRD countries)LatviaLeast developed countries: UN classificationLebanonLesothoLiberiaLibyaLiechtensteinLithuaniaLow & middle incomeLow incomeLower middle incomeLuxembourgMacao SAR, ChinaMacedonia, FYRMadagascarMalawiMalaysiaMaldivesMaliMaltaMarshall IslandsMauritaniaMauritiusMexicoMiddle East & North AfricaMiddle East & North Africa (excluding high income)Middle East & North Africa (IDA & IBRD countries)Middle incomeMoldovaMonacoMongoliaMoroccoMozambiqueMyanmarNamibiaNauruNepalNetherlandsNew ZealandNicaraguaNigerNigeriaNorth AmericaNorwayOECD membersOmanOther small statesPacific island small statesPakistanPalauPanamaPapua New GuineaParaguayPeruPhilippinesPolandPortugalPost-demographic dividendPre-demographic dividendPuerto RicoQatarRomaniaRussian FederationRwandaSamoaSan MarinoSao Tome and PrincipeSaudi ArabiaSenegalSerbiaSeychellesSierra LeoneSingaporeSint Maarten (Dutch part)Slovak RepublicSloveniaSmall statesSolomon IslandsSomaliaSouth AfricaSouth AsiaSouth Asia (IDA & IBRD)South SudanSpainSri LankaSt. Kitts and NevisSt. LuciaSt. Vincent and the GrenadinesSub-Saharan Africa Sub-Saharan Africa (excluding high income)Sub-Saharan Africa (IDA & IBRD countries)SudanSurinameSwazilandSwedenSwitzerlandSyrian Arab RepublicTajikistanTanzaniaThailandTimor-LesteTogoTongaTrinidad and TobagoTunisiaTurkeyTurks and Caicos IslandsTuvaluUgandaUkraineUnited Arab EmiratesUnited KingdomUnited StatesUpper middle incomeUruguayUzbekistanVanuatuVenezuela, RBVietnamWest Bank and GazaWorldYemen, Rep.ZambiaZimbabwe Timeline:
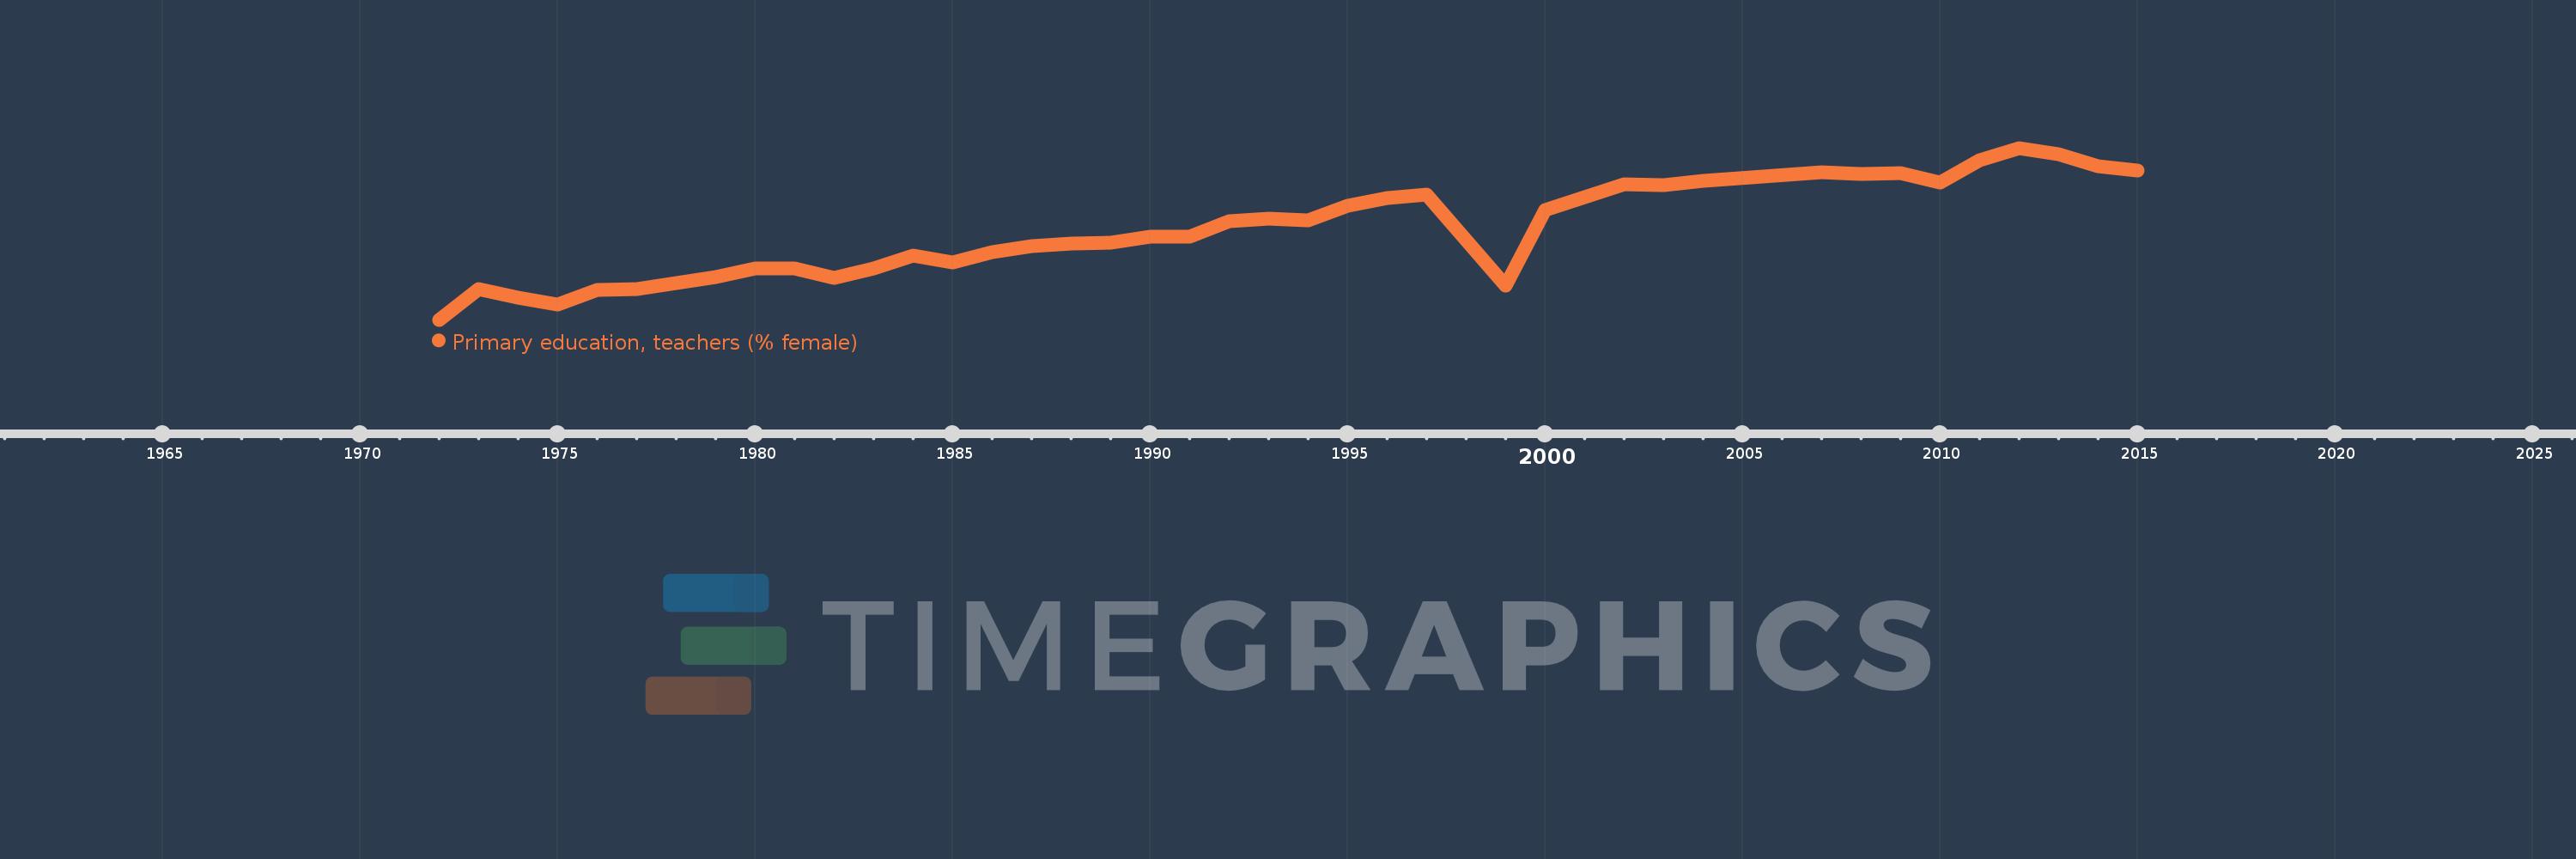
This timeline shows a graph from 1972 to 2015 of Qatar. No data until 1971. Number of actual observations by date: 40.
Source name:
World Development Indicators
Source organization:
United Nations Educational, Scientific, and Cultural Organization (UNESCO) Institute for Statistics.
Categories, topics:
Education, Gender
Last updated:
apr 23, 2017
Indicators value changes by year
Minimum:
45.984
jan 1, 1972
Maximum:
91.913
jan 1, 2012
At the date of observation
Value
Absolute change
Change from previous value
jan 1, 1972
45.984
+45.984
0.0%
jan 1, 1973
54.214
+8.23
17.9%
jan 1, 1974
51.949
-2.265
-4.18%
jan 1, 1975
50.0
-1.949
-3.75%
jan 1, 1976
53.909
+3.909
7.82%
jan 1, 1977
54.153
+0.244
0.45%
jan 1, 1978
55.846
+1.693
3.13%
jan 1, 1979
57.324
+1.478
2.65%
jan 1, 1980
59.79
+2.466
4.3%
jan 1, 1981
59.597
-0.193
-0.32%
jan 1, 1982
57.122
-2.476
-4.15%
jan 1, 1983
59.618
+2.496
4.37%
jan 1, 1984
63.238
+3.62
6.07%
jan 1, 1985
61.401
-1.837
-2.9%
jan 1, 1986
63.985
+2.584
4.21%
jan 1, 1987
65.631
+1.646
2.57%
jan 1, 1988
66.285
+0.654
1.0%
jan 1, 1989
66.479
+0.194
0.29%
jan 1, 1990
68.241
+1.762
2.65%
jan 1, 1991
68.293
+0.052
0.08%
jan 1, 1992
72.399
+4.105
6.01%
jan 1, 1993
72.945
+0.546
0.75%
jan 1, 1994
72.544
-0.401
-0.55%
jan 1, 1995
76.503
+3.959
5.46%
jan 1, 1996
78.507
+2.004
2.62%
jan 1, 1997
79.451
+0.944
1.2%
jan 1, 1999
55.027
-24.424
-30.74%
jan 1, 2000
75.258
+20.231
36.77%
jan 1, 2002
82.141
+6.883
9.15%
jan 1, 2003
81.965
-0.176
-0.21%
jan 1, 2004
83.058
+1.093
1.33%
jan 1, 2007
85.495
+2.437
2.93%
jan 1, 2008
85.039
-0.456
-0.53%
jan 1, 2009
85.291
+0.252
0.3%
jan 1, 2010
82.675
-2.616
-3.07%
jan 1, 2011
88.595
+5.92
7.16%
jan 1, 2012
91.913
+3.318
3.75%
jan 1, 2013
90.346
-1.567
-1.7%
jan 1, 2014
87.103
-3.243
-3.59%
jan 1, 2015
85.799
-1.304
-1.5%
Ranking of countries by current statistics by years


Comments: