29
/
en
AIzaSyAYiBZKx7MnpbEhh9jyipgxe19OcubqV5w
April 1, 2024
251303
St. Lucia
LCA
true
2
1
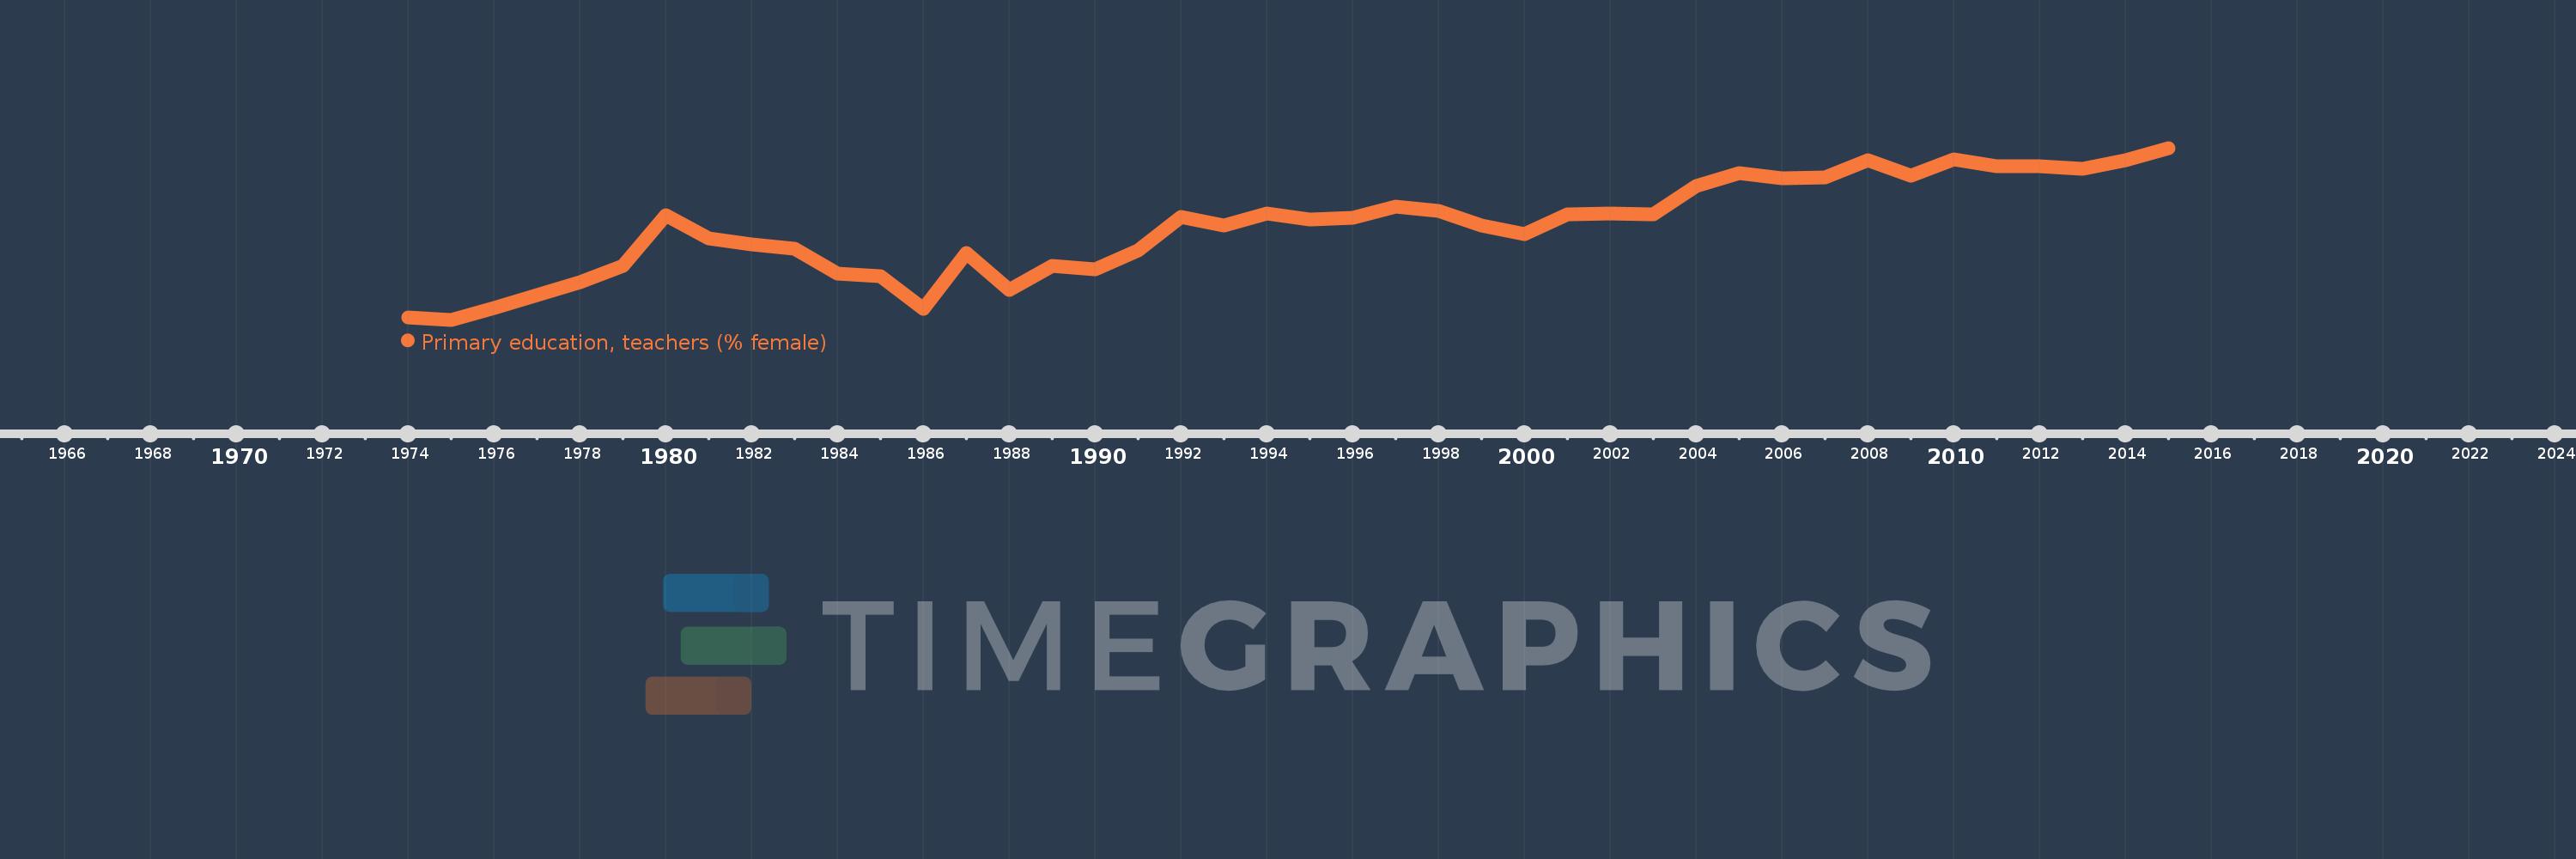
Primary education, teachers (% female)
2015,2014,2013,2012,2011,2010,2009,2008,2007,2006,2005,2004,2003,2002,2001,2000,1999,1998,1997,1996,1995,1994,1993,1992,1991,1990,1989,1988,1987,1986,1985,1984,1983,1982,1981,1980,1979,1978,1976,1975,1974
This statistics in other country:
AfghanistanAlbaniaAlgeriaAndorraAngolaAntigua and BarbudaArab WorldArgentinaArmeniaArubaAustraliaAustriaAzerbaijanBahamas, TheBahrainBangladeshBarbadosBelarusBelgiumBelizeBeninBermudaBhutanBoliviaBosnia and HerzegovinaBotswanaBrazilBritish Virgin IslandsBrunei DarussalamBulgariaBurkina FasoBurundiCabo VerdeCambodiaCameroonCanadaCaribbean small statesCayman IslandsCentral African RepublicCentral Europe and the BalticsChadChileChinaColombiaComorosCongo, Dem. Rep.Congo, Rep.Costa RicaCote d'IvoireCroatiaCubaCyprusCzech RepublicDenmarkDjiboutiDominicaDominican RepublicEarly-demographic dividendEast Asia & PacificEast Asia & Pacific (excluding high income)East Asia & Pacific (IDA & IBRD countries)EcuadorEgypt, Arab Rep.El SalvadorEquatorial GuineaEritreaEstoniaEthiopiaEuro areaEurope & Central AsiaEurope & Central Asia (excluding high income)Europe & Central Asia (IDA & IBRD countries)European UnionFijiFinlandFragile and conflict affected situationsFranceGabonGambia, TheGeorgiaGermanyGhanaGibraltarGreeceGrenadaGuatemalaGuineaGuinea-BissauGuyanaHaitiHeavily indebted poor countries (HIPC)High incomeHondurasHong Kong SAR, ChinaHungaryIBRD onlyIcelandIDA & IBRD totalIDA blendIDA onlyIDA totalIndiaIndonesiaIran, Islamic Rep.IraqIrelandIsraelItalyJamaicaJapanJordanKazakhstanKenyaKiribatiKorea, Dem. People’s Rep.Korea, Rep.KuwaitKyrgyz RepublicLao PDRLate-demographic dividendLatin America & Caribbean Latin America & Caribbean (excluding high income)Latin America & the Caribbean (IDA & IBRD countries)LatviaLeast developed countries: UN classificationLebanonLesothoLiberiaLibyaLiechtensteinLithuaniaLow & middle incomeLow incomeLower middle incomeLuxembourgMacao SAR, ChinaMacedonia, FYRMadagascarMalawiMalaysiaMaldivesMaliMaltaMarshall IslandsMauritaniaMauritiusMexicoMiddle East & North AfricaMiddle East & North Africa (excluding high income)Middle East & North Africa (IDA & IBRD countries)Middle incomeMoldovaMonacoMongoliaMoroccoMozambiqueMyanmarNamibiaNauruNepalNetherlandsNew ZealandNicaraguaNigerNigeriaNorth AmericaNorwayOECD membersOmanOther small statesPacific island small statesPakistanPalauPanamaPapua New GuineaParaguayPeruPhilippinesPolandPortugalPost-demographic dividendPre-demographic dividendPuerto RicoQatarRomaniaRussian FederationRwandaSamoaSan MarinoSao Tome and PrincipeSaudi ArabiaSenegalSerbiaSeychellesSierra LeoneSingaporeSint Maarten (Dutch part)Slovak RepublicSloveniaSmall statesSolomon IslandsSomaliaSouth AfricaSouth AsiaSouth Asia (IDA & IBRD)South SudanSpainSri LankaSt. Kitts and NevisSt. LuciaSt. Vincent and the GrenadinesSub-Saharan Africa Sub-Saharan Africa (excluding high income)Sub-Saharan Africa (IDA & IBRD countries)SudanSurinameSwazilandSwedenSwitzerlandSyrian Arab RepublicTajikistanTanzaniaThailandTimor-LesteTogoTongaTrinidad and TobagoTunisiaTurkeyTurks and Caicos IslandsTuvaluUgandaUkraineUnited Arab EmiratesUnited KingdomUnited StatesUpper middle incomeUruguayUzbekistanVanuatuVenezuela, RBVietnamWest Bank and GazaWorldYemen, Rep.ZambiaZimbabwe Timeline:
This timeline shows a graph from 1974 to 2015 of St. Lucia. No data until 1973. Number of actual observations by date: 41.
Source name:
World Development Indicators
Source organization:
United Nations Educational, Scientific, and Cultural Organization (UNESCO) Institute for Statistics.
Categories, topics:
Education, Gender
Last updated:
apr 23, 2017
Indicators value changes by year
Minimum:
73.879
jan 1, 1975
Maximum:
88.487
jan 1, 2015
At the date of observation
Value
Absolute change
Change from previous value
jan 1, 1974
74.065
+74.065
0.0%
jan 1, 1975
73.879
-0.186
-0.25%
jan 1, 1976
74.864
+0.985
1.33%
jan 1, 1978
77.086
+2.222
2.97%
jan 1, 1979
78.489
+1.403
1.82%
jan 1, 1980
82.783
+4.294
5.47%
jan 1, 1981
80.786
-1.997
-2.41%
jan 1, 1982
80.251
-0.535
-0.66%
jan 1, 1983
79.941
-0.31
-0.39%
jan 1, 1984
77.767
-2.174
-2.72%
jan 1, 1985
77.583
-0.183
-0.24%
jan 1, 1986
74.797
-2.786
-3.59%
jan 1, 1987
79.52
+4.724
6.32%
jan 1, 1988
76.428
-3.092
-3.89%
jan 1, 1989
78.424
+1.996
2.61%
jan 1, 1990
78.189
-0.235
-0.3%
jan 1, 1991
79.771
+1.583
2.02%
jan 1, 1992
82.609
+2.837
3.56%
jan 1, 1993
81.88
-0.729
-0.88%
jan 1, 1994
82.89
+1.011
1.23%
jan 1, 1995
82.368
-0.522
-0.63%
jan 1, 1996
82.574
+0.206
0.25%
jan 1, 1997
83.475
+0.9
1.09%
jan 1, 1998
83.114
-0.361
-0.43%
jan 1, 1999
81.872
-1.241
-1.49%
jan 1, 2000
81.164
-0.708
-0.86%
jan 1, 2001
82.86
+1.695
2.09%
jan 1, 2002
82.89
+0.03
0.04%
jan 1, 2003
82.86
-0.03
-0.04%
jan 1, 2004
85.222
+2.362
2.85%
jan 1, 2005
86.381
+1.159
1.36%
jan 1, 2006
85.927
-0.454
-0.53%
jan 1, 2007
86.008
+0.081
0.09%
jan 1, 2008
87.41
+1.402
1.63%
jan 1, 2009
86.094
-1.316
-1.51%
jan 1, 2010
87.537
+1.443
1.68%
jan 1, 2011
86.965
-0.572
-0.65%
jan 1, 2012
86.928
-0.037
-0.04%
jan 1, 2013
86.717
-0.211
-0.24%
jan 1, 2014
87.418
+0.701
0.81%
jan 1, 2015
88.487
+1.069
1.22%
Ranking of countries by current statistics by years


Comments: