29
/
en
AIzaSyAYiBZKx7MnpbEhh9jyipgxe19OcubqV5w
April 1, 2024
48494
Middle East & North Africa
MEA
false
2
1
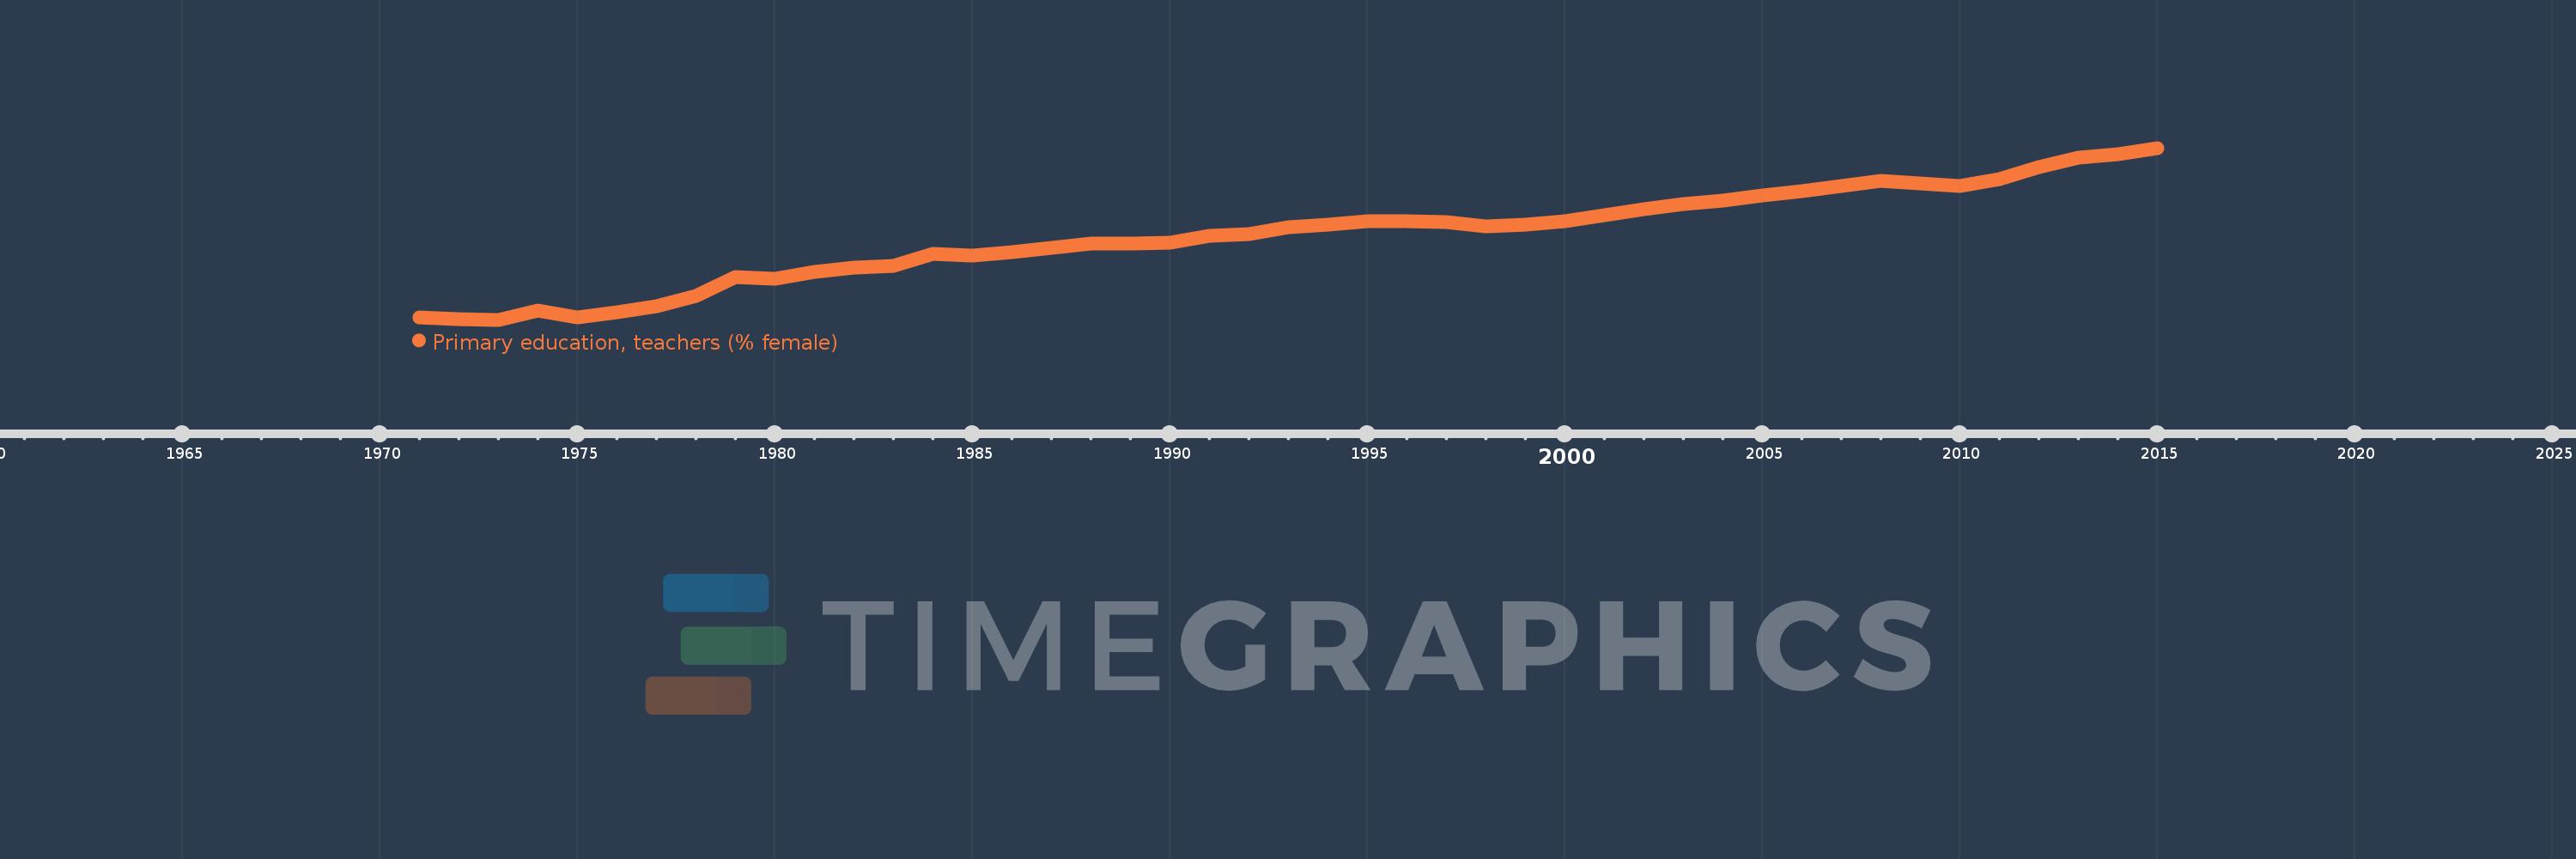
Primary education, teachers (% female)
2015,2014,2013,2012,2011,2010,2009,2008,2007,2006,2005,2004,2003,2002,2001,2000,1999,1998,1997,1996,1995,1994,1993,1992,1991,1990,1989,1988,1987,1986,1985,1984,1983,1982,1981,1980,1979,1978,1977,1976,1975,1974,1973,1972,1971
This statistics in other country:
AfghanistanAlbaniaAlgeriaAndorraAngolaAntigua and BarbudaArab WorldArgentinaArmeniaArubaAustraliaAustriaAzerbaijanBahamas, TheBahrainBangladeshBarbadosBelarusBelgiumBelizeBeninBermudaBhutanBoliviaBosnia and HerzegovinaBotswanaBrazilBritish Virgin IslandsBrunei DarussalamBulgariaBurkina FasoBurundiCabo VerdeCambodiaCameroonCanadaCaribbean small statesCayman IslandsCentral African RepublicCentral Europe and the BalticsChadChileChinaColombiaComorosCongo, Dem. Rep.Congo, Rep.Costa RicaCote d'IvoireCroatiaCubaCyprusCzech RepublicDenmarkDjiboutiDominicaDominican RepublicEarly-demographic dividendEast Asia & PacificEast Asia & Pacific (excluding high income)East Asia & Pacific (IDA & IBRD countries)EcuadorEgypt, Arab Rep.El SalvadorEquatorial GuineaEritreaEstoniaEthiopiaEuro areaEurope & Central AsiaEurope & Central Asia (excluding high income)Europe & Central Asia (IDA & IBRD countries)European UnionFijiFinlandFragile and conflict affected situationsFranceGabonGambia, TheGeorgiaGermanyGhanaGibraltarGreeceGrenadaGuatemalaGuineaGuinea-BissauGuyanaHaitiHeavily indebted poor countries (HIPC)High incomeHondurasHong Kong SAR, ChinaHungaryIBRD onlyIcelandIDA & IBRD totalIDA blendIDA onlyIDA totalIndiaIndonesiaIran, Islamic Rep.IraqIrelandIsraelItalyJamaicaJapanJordanKazakhstanKenyaKiribatiKorea, Dem. People’s Rep.Korea, Rep.KuwaitKyrgyz RepublicLao PDRLate-demographic dividendLatin America & Caribbean Latin America & Caribbean (excluding high income)Latin America & the Caribbean (IDA & IBRD countries)LatviaLeast developed countries: UN classificationLebanonLesothoLiberiaLibyaLiechtensteinLithuaniaLow & middle incomeLow incomeLower middle incomeLuxembourgMacao SAR, ChinaMacedonia, FYRMadagascarMalawiMalaysiaMaldivesMaliMaltaMarshall IslandsMauritaniaMauritiusMexicoMiddle East & North AfricaMiddle East & North Africa (excluding high income)Middle East & North Africa (IDA & IBRD countries)Middle incomeMoldovaMonacoMongoliaMoroccoMozambiqueMyanmarNamibiaNauruNepalNetherlandsNew ZealandNicaraguaNigerNigeriaNorth AmericaNorwayOECD membersOmanOther small statesPacific island small statesPakistanPalauPanamaPapua New GuineaParaguayPeruPhilippinesPolandPortugalPost-demographic dividendPre-demographic dividendPuerto RicoQatarRomaniaRussian FederationRwandaSamoaSan MarinoSao Tome and PrincipeSaudi ArabiaSenegalSerbiaSeychellesSierra LeoneSingaporeSint Maarten (Dutch part)Slovak RepublicSloveniaSmall statesSolomon IslandsSomaliaSouth AfricaSouth AsiaSouth Asia (IDA & IBRD)South SudanSpainSri LankaSt. Kitts and NevisSt. LuciaSt. Vincent and the GrenadinesSub-Saharan Africa Sub-Saharan Africa (excluding high income)Sub-Saharan Africa (IDA & IBRD countries)SudanSurinameSwazilandSwedenSwitzerlandSyrian Arab RepublicTajikistanTanzaniaThailandTimor-LesteTogoTongaTrinidad and TobagoTunisiaTurkeyTurks and Caicos IslandsTuvaluUgandaUkraineUnited Arab EmiratesUnited KingdomUnited StatesUpper middle incomeUruguayUzbekistanVanuatuVenezuela, RBVietnamWest Bank and GazaWorldYemen, Rep.ZambiaZimbabwe Timeline:
This timeline shows a graph from 1971 to 2015 of Middle East & North Africa. No data until 1970. Number of actual observations by date: 45.
Source name:
World Development Indicators
Source organization:
United Nations Educational, Scientific, and Cultural Organization (UNESCO) Institute for Statistics.
Categories, topics:
Education, Gender
Last updated:
apr 23, 2017
Indicators value changes by year
Minimum:
41.872
jan 1, 1973
Maximum:
61.102
jan 1, 2015
At the date of observation
Value
Absolute change
Change from previous value
jan 1, 1971
42.102
+42.102
0.0%
jan 1, 1972
41.965
-0.137
-0.33%
jan 1, 1973
41.872
-0.093
-0.22%
jan 1, 1974
42.93
+1.057
2.53%
jan 1, 1975
42.119
-0.811
-1.89%
jan 1, 1976
42.707
+0.588
1.4%
jan 1, 1977
43.383
+0.676
1.58%
jan 1, 1978
44.489
+1.107
2.55%
jan 1, 1979
46.672
+2.183
4.91%
jan 1, 1980
46.419
-0.253
-0.54%
jan 1, 1981
47.246
+0.827
1.78%
jan 1, 1982
47.732
+0.485
1.03%
jan 1, 1983
47.903
+0.171
0.36%
jan 1, 1984
49.235
+1.332
2.78%
jan 1, 1985
49.09
-0.145
-0.29%
jan 1, 1986
49.412
+0.321
0.65%
jan 1, 1987
49.901
+0.489
0.99%
jan 1, 1988
50.416
+0.515
1.03%
jan 1, 1989
50.403
-0.013
-0.03%
jan 1, 1990
50.488
+0.085
0.17%
jan 1, 1991
51.269
+0.781
1.55%
jan 1, 1992
51.452
+0.183
0.36%
jan 1, 1993
52.187
+0.735
1.43%
jan 1, 1994
52.511
+0.324
0.62%
jan 1, 1995
52.874
+0.363
0.69%
jan 1, 1996
52.901
+0.027
0.05%
jan 1, 1997
52.842
-0.059
-0.11%
jan 1, 1998
52.276
-0.565
-1.07%
jan 1, 1999
52.534
+0.258
0.49%
jan 1, 2000
52.925
+0.391
0.74%
jan 1, 2001
53.583
+0.657
1.24%
jan 1, 2002
54.234
+0.652
1.22%
jan 1, 2003
54.839
+0.604
1.11%
jan 1, 2004
55.217
+0.378
0.69%
jan 1, 2005
55.806
+0.589
1.07%
jan 1, 2006
56.218
+0.412
0.74%
jan 1, 2007
56.822
+0.604
1.08%
jan 1, 2008
57.38
+0.558
0.98%
jan 1, 2009
57.098
-0.282
-0.49%
jan 1, 2010
56.877
-0.222
-0.39%
jan 1, 2011
57.648
+0.771
1.36%
jan 1, 2012
58.973
+1.326
2.3%
jan 1, 2013
60.0
+1.027
1.74%
jan 1, 2014
60.405
+0.405
0.68%
jan 1, 2015
61.102
+0.697
1.15%
Ranking of countries by current statistics by years


Comments: