29
/
en
AIzaSyAYiBZKx7MnpbEhh9jyipgxe19OcubqV5w
April 1, 2024
287830
Zimbabwe
ZWE
true
2
1
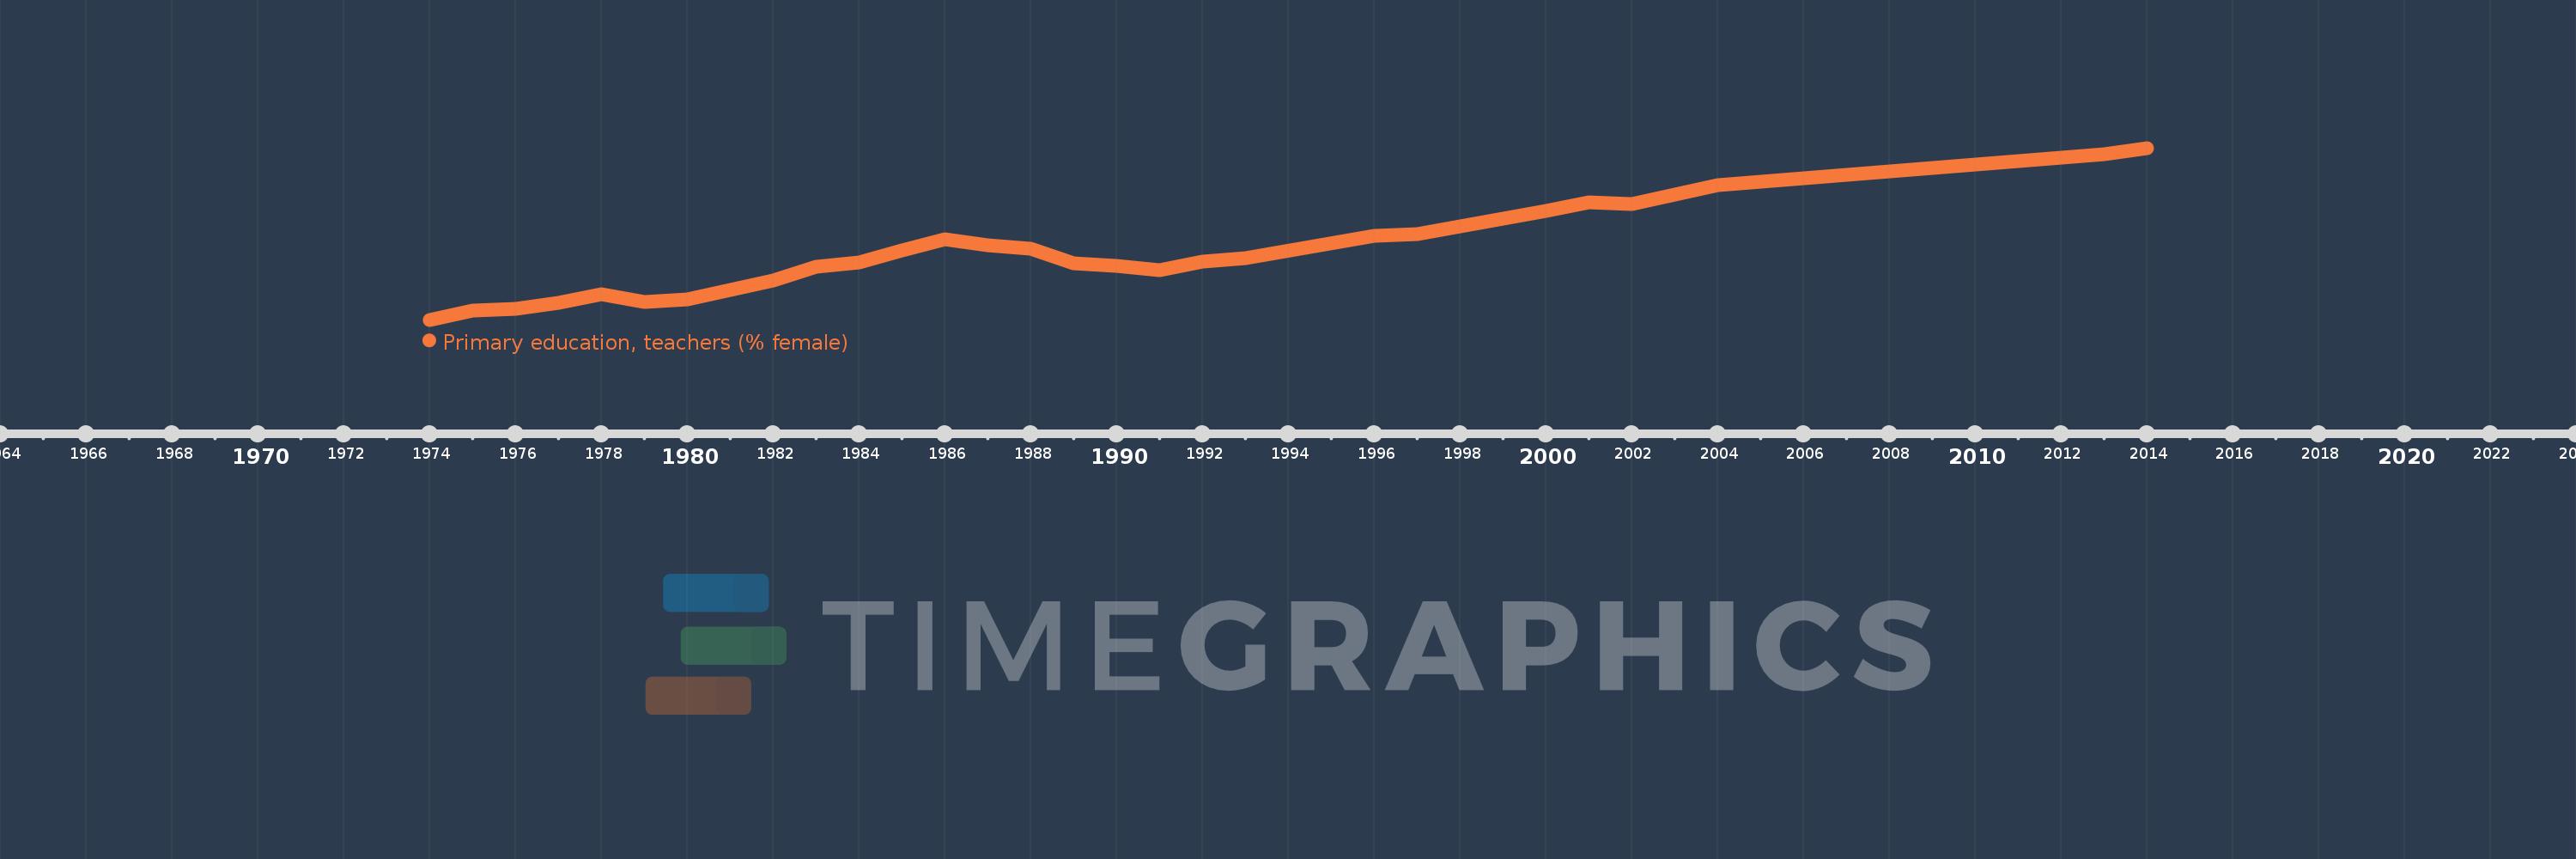
Primary education, teachers (% female)
2014,2013,2004,2003,2002,2001,2000,1997,1996,1993,1992,1991,1990,1989,1988,1987,1986,1985,1984,1983,1982,1980,1979,1978,1977,1976,1975,1974
This statistics in other country:
AfghanistanAlbaniaAlgeriaAndorraAngolaAntigua and BarbudaArab WorldArgentinaArmeniaArubaAustraliaAustriaAzerbaijanBahamas, TheBahrainBangladeshBarbadosBelarusBelgiumBelizeBeninBermudaBhutanBoliviaBosnia and HerzegovinaBotswanaBrazilBritish Virgin IslandsBrunei DarussalamBulgariaBurkina FasoBurundiCabo VerdeCambodiaCameroonCanadaCaribbean small statesCayman IslandsCentral African RepublicCentral Europe and the BalticsChadChileChinaColombiaComorosCongo, Dem. Rep.Congo, Rep.Costa RicaCote d'IvoireCroatiaCubaCyprusCzech RepublicDenmarkDjiboutiDominicaDominican RepublicEarly-demographic dividendEast Asia & PacificEast Asia & Pacific (excluding high income)East Asia & Pacific (IDA & IBRD countries)EcuadorEgypt, Arab Rep.El SalvadorEquatorial GuineaEritreaEstoniaEthiopiaEuro areaEurope & Central AsiaEurope & Central Asia (excluding high income)Europe & Central Asia (IDA & IBRD countries)European UnionFijiFinlandFragile and conflict affected situationsFranceGabonGambia, TheGeorgiaGermanyGhanaGibraltarGreeceGrenadaGuatemalaGuineaGuinea-BissauGuyanaHaitiHeavily indebted poor countries (HIPC)High incomeHondurasHong Kong SAR, ChinaHungaryIBRD onlyIcelandIDA & IBRD totalIDA blendIDA onlyIDA totalIndiaIndonesiaIran, Islamic Rep.IraqIrelandIsraelItalyJamaicaJapanJordanKazakhstanKenyaKiribatiKorea, Dem. People’s Rep.Korea, Rep.KuwaitKyrgyz RepublicLao PDRLate-demographic dividendLatin America & Caribbean Latin America & Caribbean (excluding high income)Latin America & the Caribbean (IDA & IBRD countries)LatviaLeast developed countries: UN classificationLebanonLesothoLiberiaLibyaLiechtensteinLithuaniaLow & middle incomeLow incomeLower middle incomeLuxembourgMacao SAR, ChinaMacedonia, FYRMadagascarMalawiMalaysiaMaldivesMaliMaltaMarshall IslandsMauritaniaMauritiusMexicoMiddle East & North AfricaMiddle East & North Africa (excluding high income)Middle East & North Africa (IDA & IBRD countries)Middle incomeMoldovaMonacoMongoliaMoroccoMozambiqueMyanmarNamibiaNauruNepalNetherlandsNew ZealandNicaraguaNigerNigeriaNorth AmericaNorwayOECD membersOmanOther small statesPacific island small statesPakistanPalauPanamaPapua New GuineaParaguayPeruPhilippinesPolandPortugalPost-demographic dividendPre-demographic dividendPuerto RicoQatarRomaniaRussian FederationRwandaSamoaSan MarinoSao Tome and PrincipeSaudi ArabiaSenegalSerbiaSeychellesSierra LeoneSingaporeSint Maarten (Dutch part)Slovak RepublicSloveniaSmall statesSolomon IslandsSomaliaSouth AfricaSouth AsiaSouth Asia (IDA & IBRD)South SudanSpainSri LankaSt. Kitts and NevisSt. LuciaSt. Vincent and the GrenadinesSub-Saharan Africa Sub-Saharan Africa (excluding high income)Sub-Saharan Africa (IDA & IBRD countries)SudanSurinameSwazilandSwedenSwitzerlandSyrian Arab RepublicTajikistanTanzaniaThailandTimor-LesteTogoTongaTrinidad and TobagoTunisiaTurkeyTurks and Caicos IslandsTuvaluUgandaUkraineUnited Arab EmiratesUnited KingdomUnited StatesUpper middle incomeUruguayUzbekistanVanuatuVenezuela, RBVietnamWest Bank and GazaWorldYemen, Rep.ZambiaZimbabwe Timeline:
This timeline shows a graph from 1974 to 2014 of Zimbabwe. No data until 1973. Number of actual observations by date: 28.
Source name:
World Development Indicators
Source organization:
United Nations Educational, Scientific, and Cultural Organization (UNESCO) Institute for Statistics.
Categories, topics:
Education, Gender
Last updated:
apr 23, 2017
Indicators value changes by year
Minimum:
32.578
jan 1, 1974
Maximum:
55.665
jan 1, 2014
At the date of observation
Value
Absolute change
Change from previous value
jan 1, 1974
32.578
+32.578
0.0%
jan 1, 1975
33.832
+1.253
3.85%
jan 1, 1976
34.025
+0.194
0.57%
jan 1, 1977
34.875
+0.85
2.5%
jan 1, 1978
35.991
+1.116
3.2%
jan 1, 1979
34.924
-1.067
-2.97%
jan 1, 1980
35.33
+0.406
1.16%
jan 1, 1982
37.831
+2.501
7.08%
jan 1, 1983
39.752
+1.921
5.08%
jan 1, 1984
40.24
+0.488
1.23%
jan 1, 1985
41.848
+1.608
4.0%
jan 1, 1986
43.425
+1.577
3.77%
jan 1, 1987
42.548
-0.877
-2.02%
jan 1, 1988
42.078
-0.47
-1.1%
jan 1, 1989
40.203
-1.875
-4.46%
jan 1, 1990
39.774
-0.429
-1.07%
jan 1, 1991
39.242
-0.533
-1.34%
jan 1, 1992
40.381
+1.139
2.9%
jan 1, 1993
40.888
+0.507
1.26%
jan 1, 1996
43.879
+2.99
7.31%
jan 1, 1997
44.115
+0.236
0.54%
jan 1, 2000
47.253
+3.138
7.11%
jan 1, 2001
48.311
+1.058
2.24%
jan 1, 2002
48.168
-0.143
-0.3%
jan 1, 2003
49.388
+1.22
2.53%
jan 1, 2004
50.634
+1.246
2.52%
jan 1, 2013
54.772
+4.138
8.17%
jan 1, 2014
55.665
+0.893
1.63%
Ranking of countries by current statistics by years


Comments: