29
/
en
AIzaSyAYiBZKx7MnpbEhh9jyipgxe19OcubqV5w
April 1, 2024
114208
Cote d'Ivoire
CIV
true
2
1
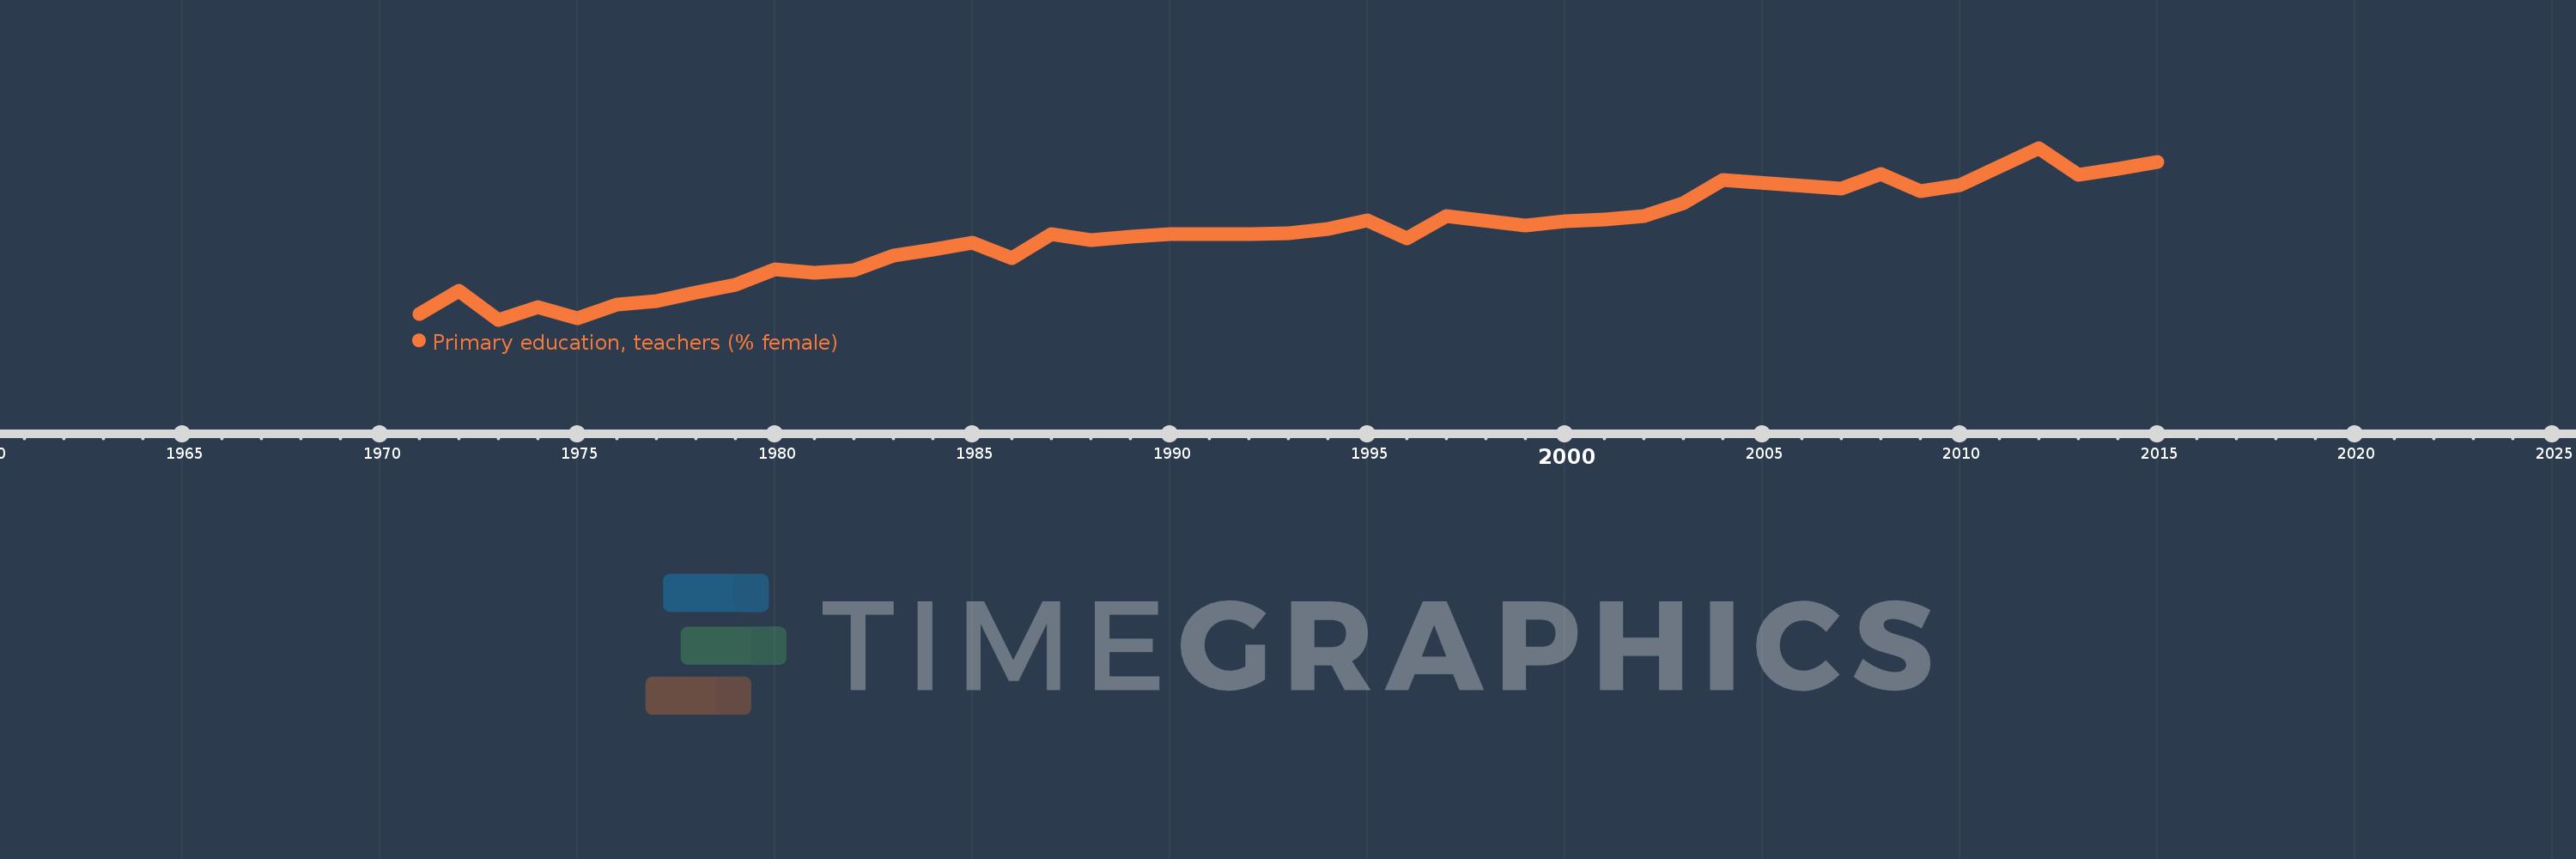
Primary education, teachers (% female)
2015,2014,2013,2012,2010,2009,2008,2007,2004,2003,2002,2001,2000,1999,1997,1996,1995,1994,1993,1992,1991,1990,1989,1988,1987,1986,1985,1984,1983,1982,1981,1980,1979,1978,1977,1976,1975,1974,1973,1972,1971
This statistics in other country:
AfghanistanAlbaniaAlgeriaAndorraAngolaAntigua and BarbudaArab WorldArgentinaArmeniaArubaAustraliaAustriaAzerbaijanBahamas, TheBahrainBangladeshBarbadosBelarusBelgiumBelizeBeninBermudaBhutanBoliviaBosnia and HerzegovinaBotswanaBrazilBritish Virgin IslandsBrunei DarussalamBulgariaBurkina FasoBurundiCabo VerdeCambodiaCameroonCanadaCaribbean small statesCayman IslandsCentral African RepublicCentral Europe and the BalticsChadChileChinaColombiaComorosCongo, Dem. Rep.Congo, Rep.Costa RicaCote d'IvoireCroatiaCubaCyprusCzech RepublicDenmarkDjiboutiDominicaDominican RepublicEarly-demographic dividendEast Asia & PacificEast Asia & Pacific (excluding high income)East Asia & Pacific (IDA & IBRD countries)EcuadorEgypt, Arab Rep.El SalvadorEquatorial GuineaEritreaEstoniaEthiopiaEuro areaEurope & Central AsiaEurope & Central Asia (excluding high income)Europe & Central Asia (IDA & IBRD countries)European UnionFijiFinlandFragile and conflict affected situationsFranceGabonGambia, TheGeorgiaGermanyGhanaGibraltarGreeceGrenadaGuatemalaGuineaGuinea-BissauGuyanaHaitiHeavily indebted poor countries (HIPC)High incomeHondurasHong Kong SAR, ChinaHungaryIBRD onlyIcelandIDA & IBRD totalIDA blendIDA onlyIDA totalIndiaIndonesiaIran, Islamic Rep.IraqIrelandIsraelItalyJamaicaJapanJordanKazakhstanKenyaKiribatiKorea, Dem. People’s Rep.Korea, Rep.KuwaitKyrgyz RepublicLao PDRLate-demographic dividendLatin America & Caribbean Latin America & Caribbean (excluding high income)Latin America & the Caribbean (IDA & IBRD countries)LatviaLeast developed countries: UN classificationLebanonLesothoLiberiaLibyaLiechtensteinLithuaniaLow & middle incomeLow incomeLower middle incomeLuxembourgMacao SAR, ChinaMacedonia, FYRMadagascarMalawiMalaysiaMaldivesMaliMaltaMarshall IslandsMauritaniaMauritiusMexicoMiddle East & North AfricaMiddle East & North Africa (excluding high income)Middle East & North Africa (IDA & IBRD countries)Middle incomeMoldovaMonacoMongoliaMoroccoMozambiqueMyanmarNamibiaNauruNepalNetherlandsNew ZealandNicaraguaNigerNigeriaNorth AmericaNorwayOECD membersOmanOther small statesPacific island small statesPakistanPalauPanamaPapua New GuineaParaguayPeruPhilippinesPolandPortugalPost-demographic dividendPre-demographic dividendPuerto RicoQatarRomaniaRussian FederationRwandaSamoaSan MarinoSao Tome and PrincipeSaudi ArabiaSenegalSerbiaSeychellesSierra LeoneSingaporeSint Maarten (Dutch part)Slovak RepublicSloveniaSmall statesSolomon IslandsSomaliaSouth AfricaSouth AsiaSouth Asia (IDA & IBRD)South SudanSpainSri LankaSt. Kitts and NevisSt. LuciaSt. Vincent and the GrenadinesSub-Saharan Africa Sub-Saharan Africa (excluding high income)Sub-Saharan Africa (IDA & IBRD countries)SudanSurinameSwazilandSwedenSwitzerlandSyrian Arab RepublicTajikistanTanzaniaThailandTimor-LesteTogoTongaTrinidad and TobagoTunisiaTurkeyTurks and Caicos IslandsTuvaluUgandaUkraineUnited Arab EmiratesUnited KingdomUnited StatesUpper middle incomeUruguayUzbekistanVanuatuVenezuela, RBVietnamWest Bank and GazaWorldYemen, Rep.ZambiaZimbabwe Timeline:
This timeline shows a graph from 1971 to 2015 of Cote d'Ivoire. No data until 1970. Number of actual observations by date: 41.
Source name:
World Development Indicators
Source organization:
United Nations Educational, Scientific, and Cultural Organization (UNESCO) Institute for Statistics.
Categories, topics:
Education, Gender
Last updated:
apr 23, 2017
Indicators value changes by year
Minimum:
10.618
jan 1, 1973
Maximum:
27.018
jan 1, 2012
At the date of observation
Value
Absolute change
Change from previous value
jan 1, 1971
11.147
+11.147
0.0%
jan 1, 1972
13.357
+2.21
19.83%
jan 1, 1973
10.618
-2.739
-20.5%
jan 1, 1974
11.802
+1.184
11.15%
jan 1, 1975
10.777
-1.026
-8.69%
jan 1, 1976
12.046
+1.269
11.78%
jan 1, 1977
12.41
+0.364
3.02%
jan 1, 1978
13.23
+0.82
6.61%
jan 1, 1979
13.95
+0.719
5.44%
jan 1, 1980
15.434
+1.485
10.64%
jan 1, 1981
15.08
-0.355
-2.3%
jan 1, 1982
15.382
+0.302
2.0%
jan 1, 1983
16.726
+1.344
8.74%
jan 1, 1984
17.318
+0.592
3.54%
jan 1, 1985
18.011
+0.693
4.0%
jan 1, 1986
16.511
-1.499
-8.32%
jan 1, 1987
18.773
+2.262
13.7%
jan 1, 1988
18.19
-0.583
-3.1%
jan 1, 1989
18.577
+0.387
2.12%
jan 1, 1990
18.779
+0.202
1.09%
jan 1, 1991
18.785
+0.006
0.03%
jan 1, 1992
18.82
+0.034
0.18%
jan 1, 1993
18.913
+0.094
0.5%
jan 1, 1994
19.286
+0.372
1.97%
jan 1, 1995
20.095
+0.81
4.2%
jan 1, 1996
18.418
-1.678
-8.35%
jan 1, 1997
20.501
+2.084
11.31%
jan 1, 1999
19.628
-0.873
-4.26%
jan 1, 2000
20.006
+0.378
1.92%
jan 1, 2001
20.181
+0.174
0.87%
jan 1, 2002
20.482
+0.302
1.49%
jan 1, 2003
21.778
+1.296
6.33%
jan 1, 2004
23.99
+2.212
10.15%
jan 1, 2007
23.151
-0.839
-3.5%
jan 1, 2008
24.499
+1.348
5.82%
jan 1, 2009
22.872
-1.627
-6.64%
jan 1, 2010
23.447
+0.575
2.51%
jan 1, 2012
27.018
+3.571
15.23%
jan 1, 2013
24.412
-2.606
-9.65%
jan 1, 2014
25.026
+0.615
2.52%
jan 1, 2015
25.659
+0.633
2.53%
Ranking of countries by current statistics by years


Comments: