29
/
en
AIzaSyAYiBZKx7MnpbEhh9jyipgxe19OcubqV5w
April 1, 2024
151960
Hong Kong SAR, China
HKG
true
2
1
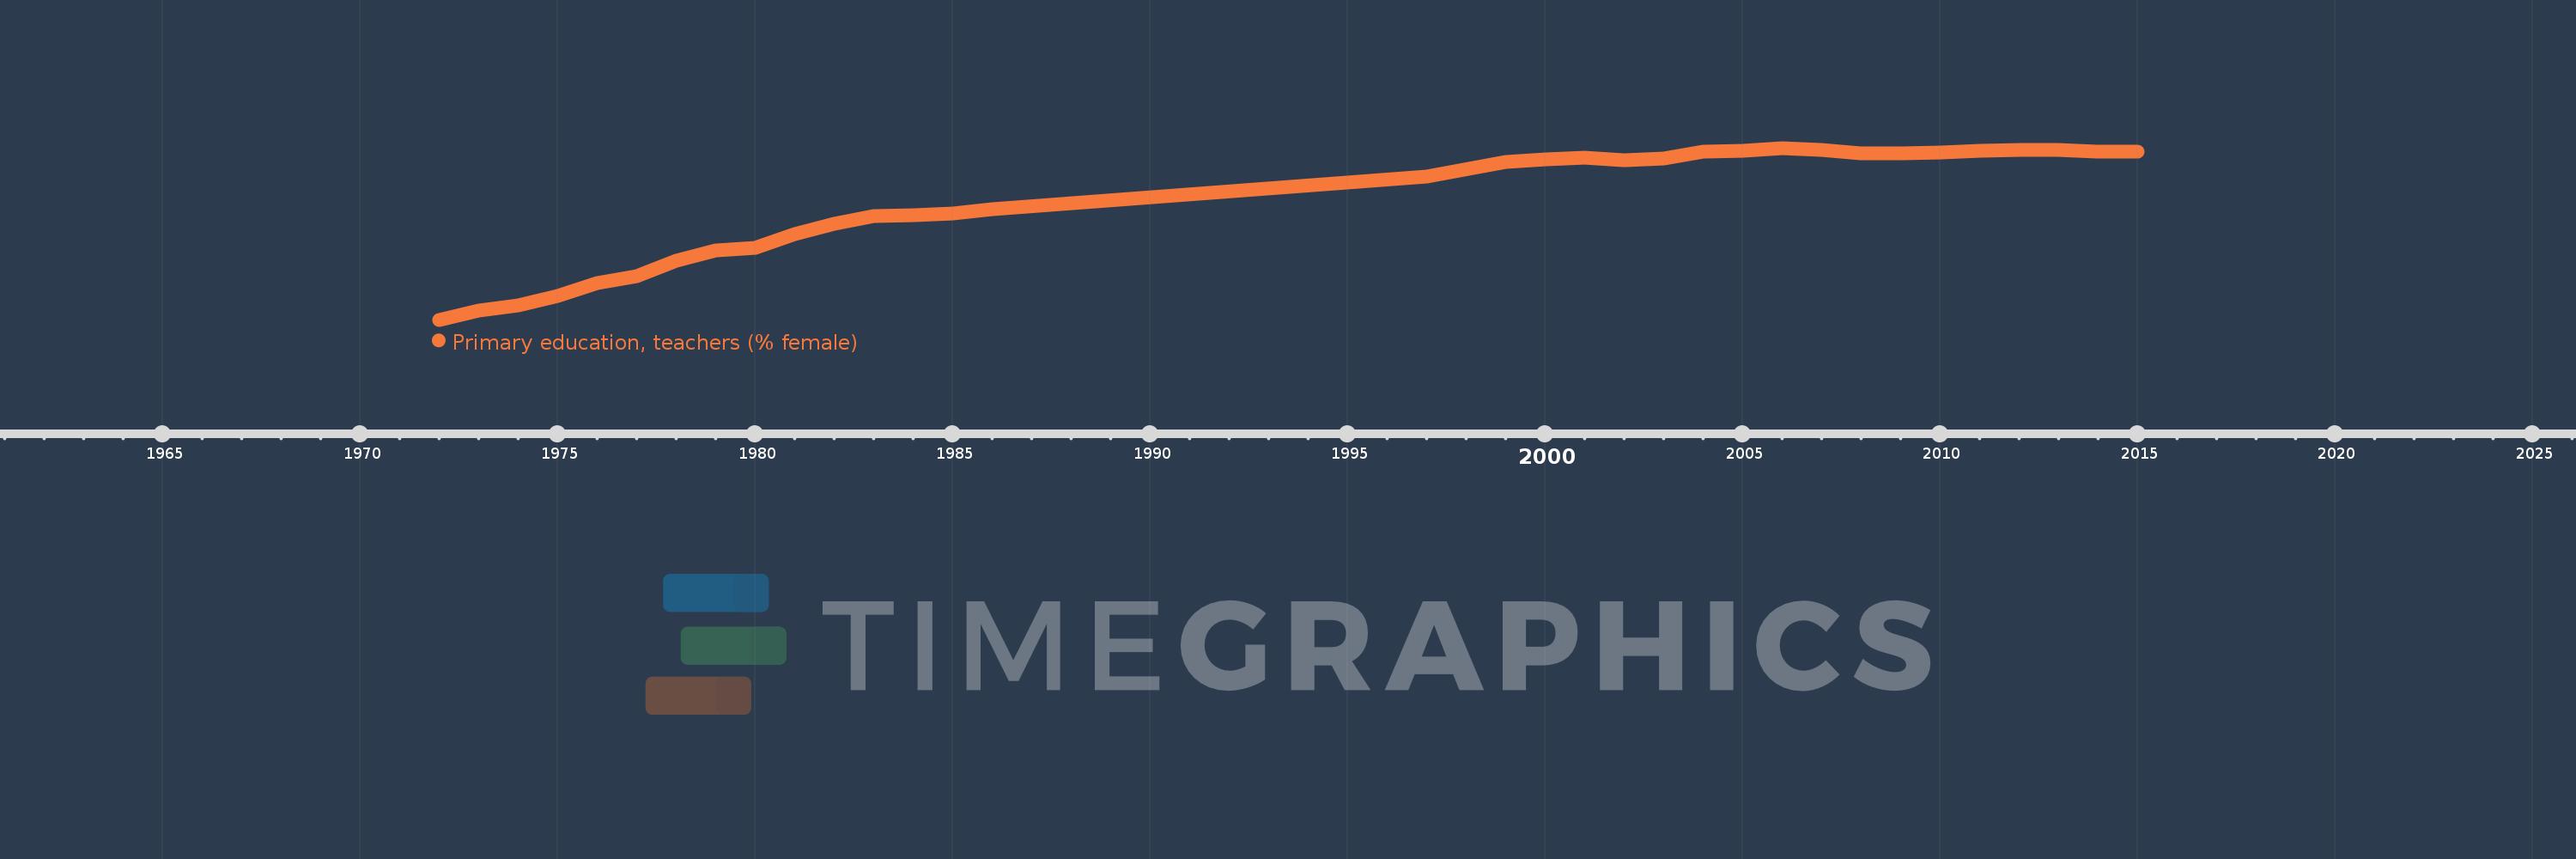
Primary education, teachers (% female)
2015,2014,2013,2012,2011,2010,2009,2008,2007,2006,2005,2004,2003,2002,2001,2000,1999,1997,1986,1985,1984,1983,1982,1981,1980,1979,1978,1977,1976,1975,1974,1973,1972
This statistics in other country:
AfghanistanAlbaniaAlgeriaAndorraAngolaAntigua and BarbudaArab WorldArgentinaArmeniaArubaAustraliaAustriaAzerbaijanBahamas, TheBahrainBangladeshBarbadosBelarusBelgiumBelizeBeninBermudaBhutanBoliviaBosnia and HerzegovinaBotswanaBrazilBritish Virgin IslandsBrunei DarussalamBulgariaBurkina FasoBurundiCabo VerdeCambodiaCameroonCanadaCaribbean small statesCayman IslandsCentral African RepublicCentral Europe and the BalticsChadChileChinaColombiaComorosCongo, Dem. Rep.Congo, Rep.Costa RicaCote d'IvoireCroatiaCubaCyprusCzech RepublicDenmarkDjiboutiDominicaDominican RepublicEarly-demographic dividendEast Asia & PacificEast Asia & Pacific (excluding high income)East Asia & Pacific (IDA & IBRD countries)EcuadorEgypt, Arab Rep.El SalvadorEquatorial GuineaEritreaEstoniaEthiopiaEuro areaEurope & Central AsiaEurope & Central Asia (excluding high income)Europe & Central Asia (IDA & IBRD countries)European UnionFijiFinlandFragile and conflict affected situationsFranceGabonGambia, TheGeorgiaGermanyGhanaGibraltarGreeceGrenadaGuatemalaGuineaGuinea-BissauGuyanaHaitiHeavily indebted poor countries (HIPC)High incomeHondurasHong Kong SAR, ChinaHungaryIBRD onlyIcelandIDA & IBRD totalIDA blendIDA onlyIDA totalIndiaIndonesiaIran, Islamic Rep.IraqIrelandIsraelItalyJamaicaJapanJordanKazakhstanKenyaKiribatiKorea, Dem. People’s Rep.Korea, Rep.KuwaitKyrgyz RepublicLao PDRLate-demographic dividendLatin America & Caribbean Latin America & Caribbean (excluding high income)Latin America & the Caribbean (IDA & IBRD countries)LatviaLeast developed countries: UN classificationLebanonLesothoLiberiaLibyaLiechtensteinLithuaniaLow & middle incomeLow incomeLower middle incomeLuxembourgMacao SAR, ChinaMacedonia, FYRMadagascarMalawiMalaysiaMaldivesMaliMaltaMarshall IslandsMauritaniaMauritiusMexicoMiddle East & North AfricaMiddle East & North Africa (excluding high income)Middle East & North Africa (IDA & IBRD countries)Middle incomeMoldovaMonacoMongoliaMoroccoMozambiqueMyanmarNamibiaNauruNepalNetherlandsNew ZealandNicaraguaNigerNigeriaNorth AmericaNorwayOECD membersOmanOther small statesPacific island small statesPakistanPalauPanamaPapua New GuineaParaguayPeruPhilippinesPolandPortugalPost-demographic dividendPre-demographic dividendPuerto RicoQatarRomaniaRussian FederationRwandaSamoaSan MarinoSao Tome and PrincipeSaudi ArabiaSenegalSerbiaSeychellesSierra LeoneSingaporeSint Maarten (Dutch part)Slovak RepublicSloveniaSmall statesSolomon IslandsSomaliaSouth AfricaSouth AsiaSouth Asia (IDA & IBRD)South SudanSpainSri LankaSt. Kitts and NevisSt. LuciaSt. Vincent and the GrenadinesSub-Saharan Africa Sub-Saharan Africa (excluding high income)Sub-Saharan Africa (IDA & IBRD countries)SudanSurinameSwazilandSwedenSwitzerlandSyrian Arab RepublicTajikistanTanzaniaThailandTimor-LesteTogoTongaTrinidad and TobagoTunisiaTurkeyTurks and Caicos IslandsTuvaluUgandaUkraineUnited Arab EmiratesUnited KingdomUnited StatesUpper middle incomeUruguayUzbekistanVanuatuVenezuela, RBVietnamWest Bank and GazaWorldYemen, Rep.ZambiaZimbabwe Timeline:
This timeline shows a graph from 1972 to 2015 of Hong Kong SAR, China. No data until 1971. Number of actual observations by date: 33.
Source name:
World Development Indicators
Source organization:
United Nations Educational, Scientific, and Cultural Organization (UNESCO) Institute for Statistics.
Categories, topics:
Education, Gender
Last updated:
apr 23, 2017
Indicators value changes by year
Minimum:
65.273
jan 1, 1972
Maximum:
78.264
jan 1, 2006
At the date of observation
Value
Absolute change
Change from previous value
jan 1, 1972
65.273
+65.273
0.0%
jan 1, 1973
65.952
+0.679
1.04%
jan 1, 1974
66.386
+0.433
0.66%
jan 1, 1975
67.044
+0.658
0.99%
jan 1, 1976
68.033
+0.989
1.48%
jan 1, 1977
68.576
+0.544
0.8%
jan 1, 1978
69.739
+1.162
1.69%
jan 1, 1979
70.508
+0.77
1.1%
jan 1, 1980
70.695
+0.187
0.26%
jan 1, 1981
71.759
+1.065
1.51%
jan 1, 1982
72.56
+0.8
1.11%
jan 1, 1983
73.142
+0.582
0.8%
jan 1, 1984
73.164
+0.022
0.03%
jan 1, 1985
73.295
+0.131
0.18%
jan 1, 1986
73.651
+0.355
0.48%
jan 1, 1997
76.109
+2.458
3.34%
jan 1, 1999
77.191
+1.082
1.42%
jan 1, 2000
77.417
+0.226
0.29%
jan 1, 2001
77.5
+0.083
0.11%
jan 1, 2002
77.341
-0.159
-0.21%
jan 1, 2003
77.436
+0.095
0.12%
jan 1, 2004
77.97
+0.534
0.69%
jan 1, 2005
78.071
+0.102
0.13%
jan 1, 2006
78.264
+0.193
0.25%
jan 1, 2007
78.126
-0.138
-0.18%
jan 1, 2008
77.836
-0.29
-0.37%
jan 1, 2009
77.887
+0.05
0.06%
jan 1, 2010
77.893
+0.007
0.01%
jan 1, 2011
78.054
+0.161
0.21%
jan 1, 2012
78.124
+0.07
0.09%
jan 1, 2013
78.114
-0.01
-0.01%
jan 1, 2014
77.998
-0.116
-0.15%
jan 1, 2015
77.989
-0.008
-0.01%
Ranking of countries by current statistics by years


Comments: