29
/
en
AIzaSyAYiBZKx7MnpbEhh9jyipgxe19OcubqV5w
April 1, 2024
168977
Kiribati
KIR
true
2
1
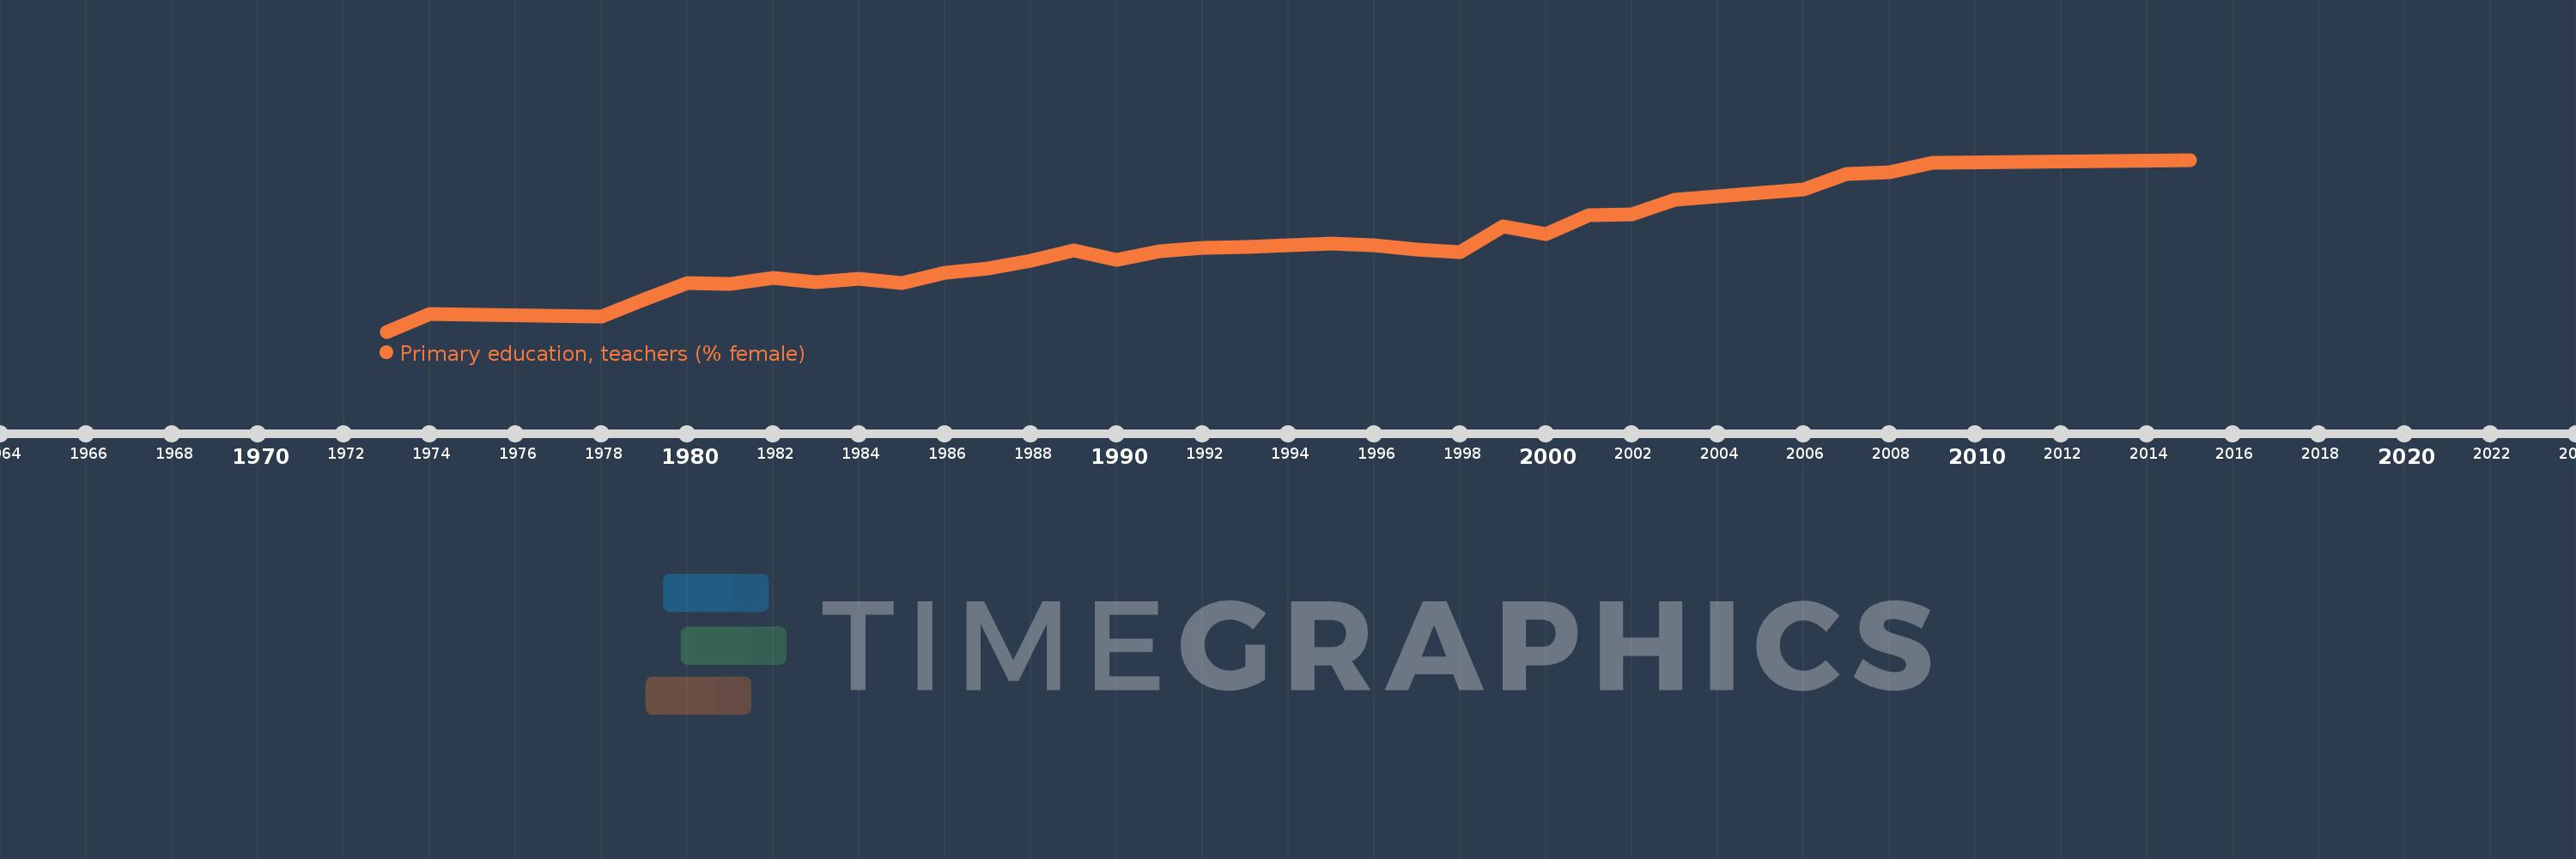
Primary education, teachers (% female)
2015,2009,2008,2007,2006,2005,2004,2003,2002,2001,2000,1999,1998,1997,1996,1995,1994,1993,1992,1991,1990,1989,1988,1987,1986,1985,1984,1983,1982,1981,1980,1979,1978,1974,1973
This statistics in other country:
AfghanistanAlbaniaAlgeriaAndorraAngolaAntigua and BarbudaArab WorldArgentinaArmeniaArubaAustraliaAustriaAzerbaijanBahamas, TheBahrainBangladeshBarbadosBelarusBelgiumBelizeBeninBermudaBhutanBoliviaBosnia and HerzegovinaBotswanaBrazilBritish Virgin IslandsBrunei DarussalamBulgariaBurkina FasoBurundiCabo VerdeCambodiaCameroonCanadaCaribbean small statesCayman IslandsCentral African RepublicCentral Europe and the BalticsChadChileChinaColombiaComorosCongo, Dem. Rep.Congo, Rep.Costa RicaCote d'IvoireCroatiaCubaCyprusCzech RepublicDenmarkDjiboutiDominicaDominican RepublicEarly-demographic dividendEast Asia & PacificEast Asia & Pacific (excluding high income)East Asia & Pacific (IDA & IBRD countries)EcuadorEgypt, Arab Rep.El SalvadorEquatorial GuineaEritreaEstoniaEthiopiaEuro areaEurope & Central AsiaEurope & Central Asia (excluding high income)Europe & Central Asia (IDA & IBRD countries)European UnionFijiFinlandFragile and conflict affected situationsFranceGabonGambia, TheGeorgiaGermanyGhanaGibraltarGreeceGrenadaGuatemalaGuineaGuinea-BissauGuyanaHaitiHeavily indebted poor countries (HIPC)High incomeHondurasHong Kong SAR, ChinaHungaryIBRD onlyIcelandIDA & IBRD totalIDA blendIDA onlyIDA totalIndiaIndonesiaIran, Islamic Rep.IraqIrelandIsraelItalyJamaicaJapanJordanKazakhstanKenyaKiribatiKorea, Dem. People’s Rep.Korea, Rep.KuwaitKyrgyz RepublicLao PDRLate-demographic dividendLatin America & Caribbean Latin America & Caribbean (excluding high income)Latin America & the Caribbean (IDA & IBRD countries)LatviaLeast developed countries: UN classificationLebanonLesothoLiberiaLibyaLiechtensteinLithuaniaLow & middle incomeLow incomeLower middle incomeLuxembourgMacao SAR, ChinaMacedonia, FYRMadagascarMalawiMalaysiaMaldivesMaliMaltaMarshall IslandsMauritaniaMauritiusMexicoMiddle East & North AfricaMiddle East & North Africa (excluding high income)Middle East & North Africa (IDA & IBRD countries)Middle incomeMoldovaMonacoMongoliaMoroccoMozambiqueMyanmarNamibiaNauruNepalNetherlandsNew ZealandNicaraguaNigerNigeriaNorth AmericaNorwayOECD membersOmanOther small statesPacific island small statesPakistanPalauPanamaPapua New GuineaParaguayPeruPhilippinesPolandPortugalPost-demographic dividendPre-demographic dividendPuerto RicoQatarRomaniaRussian FederationRwandaSamoaSan MarinoSao Tome and PrincipeSaudi ArabiaSenegalSerbiaSeychellesSierra LeoneSingaporeSint Maarten (Dutch part)Slovak RepublicSloveniaSmall statesSolomon IslandsSomaliaSouth AfricaSouth AsiaSouth Asia (IDA & IBRD)South SudanSpainSri LankaSt. Kitts and NevisSt. LuciaSt. Vincent and the GrenadinesSub-Saharan Africa Sub-Saharan Africa (excluding high income)Sub-Saharan Africa (IDA & IBRD countries)SudanSurinameSwazilandSwedenSwitzerlandSyrian Arab RepublicTajikistanTanzaniaThailandTimor-LesteTogoTongaTrinidad and TobagoTunisiaTurkeyTurks and Caicos IslandsTuvaluUgandaUkraineUnited Arab EmiratesUnited KingdomUnited StatesUpper middle incomeUruguayUzbekistanVanuatuVenezuela, RBVietnamWest Bank and GazaWorldYemen, Rep.ZambiaZimbabwe Timeline:
This timeline shows a graph from 1973 to 2015 of Kiribati. No data until 1972. Number of actual observations by date: 35.
Source name:
World Development Indicators
Source organization:
United Nations Educational, Scientific, and Cultural Organization (UNESCO) Institute for Statistics.
Categories, topics:
Education, Gender
Last updated:
apr 23, 2017
Indicators value changes by year
Minimum:
35.217
jan 1, 1973
At the date of observation
Value
Absolute change
Change from previous value
jan 1, 1973
35.217
+35.217
0.0%
jan 1, 1974
40.162
+4.945
14.04%
jan 1, 1978
39.31
-0.851
-2.12%
jan 1, 1979
44.056
+4.746
12.07%
jan 1, 1980
48.485
+4.429
10.05%
jan 1, 1981
48.276
-0.209
-0.43%
jan 1, 1982
49.888
+1.612
3.34%
jan 1, 1983
48.889
-0.999
-2.0%
jan 1, 1984
49.669
+0.78
1.6%
jan 1, 1985
48.62
-1.049
-2.11%
jan 1, 1986
51.304
+2.684
5.52%
jan 1, 1987
52.677
+1.372
2.67%
jan 1, 1988
54.725
+2.049
3.89%
jan 1, 1989
57.516
+2.791
5.1%
jan 1, 1990
55.03
-2.487
-4.32%
jan 1, 1991
57.393
+2.363
4.29%
jan 1, 1992
58.161
+0.768
1.34%
jan 1, 1993
58.532
+0.371
0.64%
jan 1, 1994
59.032
+0.5
0.85%
jan 1, 1995
59.41
+0.378
0.64%
jan 1, 1996
58.974
-0.435
-0.73%
jan 1, 1997
57.787
-1.187
-2.01%
jan 1, 1998
57.084
-0.703
-1.22%
jan 1, 1999
64.028
+6.944
12.16%
jan 1, 2000
61.962
-2.066
-3.23%
jan 1, 2001
67.174
+5.212
8.41%
jan 1, 2002
67.47
+0.296
0.44%
jan 1, 2003
71.364
+3.894
5.77%
jan 1, 2004
72.315
+0.952
1.33%
jan 1, 2005
73.302
+0.986
1.36%
jan 1, 2006
74.159
+0.857
1.17%
jan 1, 2007
78.548
+4.389
5.92%
jan 1, 2008
79.03
+0.482
0.61%
jan 1, 2009
81.55
+2.521
3.19%
jan 1, 2015
82.41
+0.86
1.05%
Ranking of countries by current statistics by years


Comments: