29
/
en
AIzaSyAYiBZKx7MnpbEhh9jyipgxe19OcubqV5w
April 1, 2024
194844
Mauritius
MUS
true
2
1
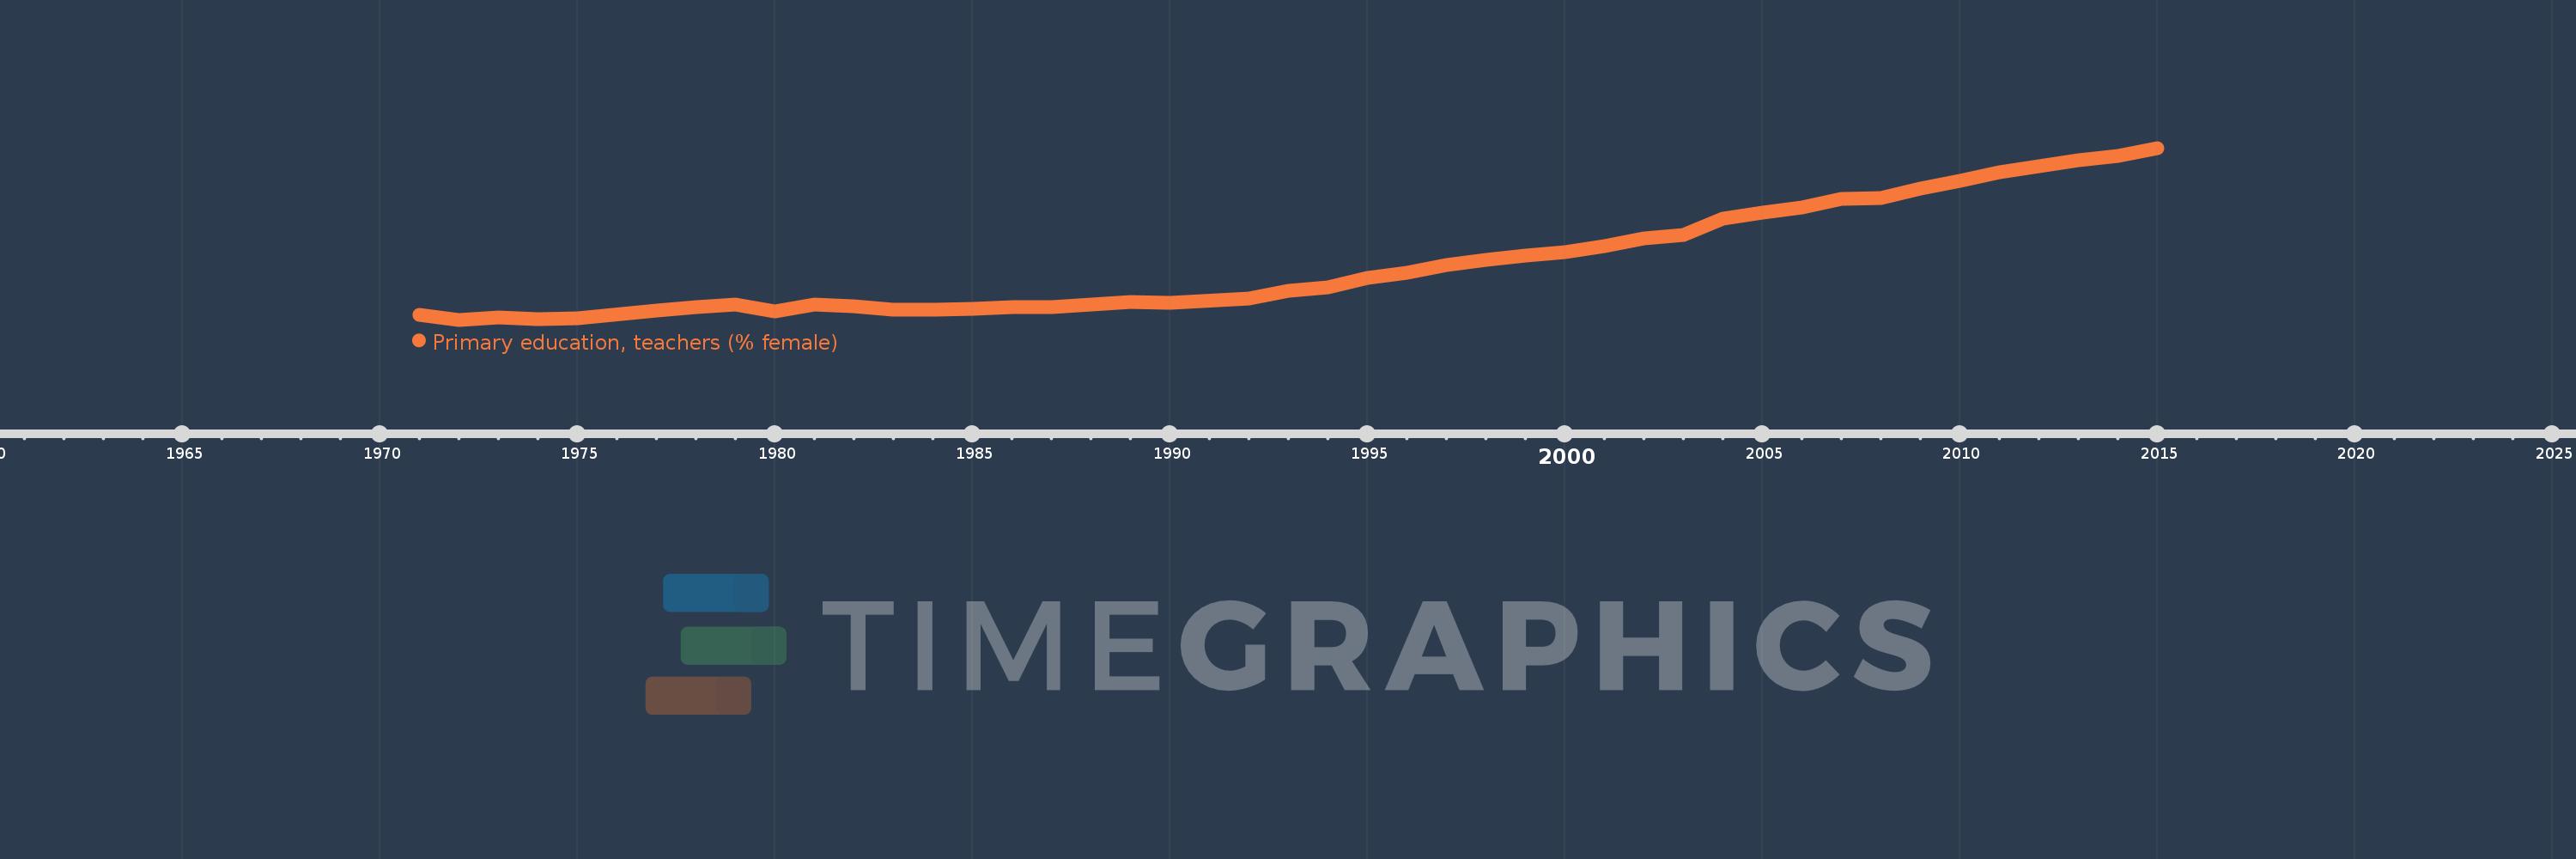
Primary education, teachers (% female)
2015,2014,2013,2012,2011,2010,2009,2008,2007,2006,2005,2004,2003,2002,2001,2000,1999,1998,1997,1996,1995,1994,1993,1992,1990,1989,1988,1987,1986,1985,1984,1983,1982,1981,1980,1979,1978,1977,1975,1974,1973,1972,1971
This statistics in other country:
AfghanistanAlbaniaAlgeriaAndorraAngolaAntigua and BarbudaArab WorldArgentinaArmeniaArubaAustraliaAustriaAzerbaijanBahamas, TheBahrainBangladeshBarbadosBelarusBelgiumBelizeBeninBermudaBhutanBoliviaBosnia and HerzegovinaBotswanaBrazilBritish Virgin IslandsBrunei DarussalamBulgariaBurkina FasoBurundiCabo VerdeCambodiaCameroonCanadaCaribbean small statesCayman IslandsCentral African RepublicCentral Europe and the BalticsChadChileChinaColombiaComorosCongo, Dem. Rep.Congo, Rep.Costa RicaCote d'IvoireCroatiaCubaCyprusCzech RepublicDenmarkDjiboutiDominicaDominican RepublicEarly-demographic dividendEast Asia & PacificEast Asia & Pacific (excluding high income)East Asia & Pacific (IDA & IBRD countries)EcuadorEgypt, Arab Rep.El SalvadorEquatorial GuineaEritreaEstoniaEthiopiaEuro areaEurope & Central AsiaEurope & Central Asia (excluding high income)Europe & Central Asia (IDA & IBRD countries)European UnionFijiFinlandFragile and conflict affected situationsFranceGabonGambia, TheGeorgiaGermanyGhanaGibraltarGreeceGrenadaGuatemalaGuineaGuinea-BissauGuyanaHaitiHeavily indebted poor countries (HIPC)High incomeHondurasHong Kong SAR, ChinaHungaryIBRD onlyIcelandIDA & IBRD totalIDA blendIDA onlyIDA totalIndiaIndonesiaIran, Islamic Rep.IraqIrelandIsraelItalyJamaicaJapanJordanKazakhstanKenyaKiribatiKorea, Dem. People’s Rep.Korea, Rep.KuwaitKyrgyz RepublicLao PDRLate-demographic dividendLatin America & Caribbean Latin America & Caribbean (excluding high income)Latin America & the Caribbean (IDA & IBRD countries)LatviaLeast developed countries: UN classificationLebanonLesothoLiberiaLibyaLiechtensteinLithuaniaLow & middle incomeLow incomeLower middle incomeLuxembourgMacao SAR, ChinaMacedonia, FYRMadagascarMalawiMalaysiaMaldivesMaliMaltaMarshall IslandsMauritaniaMauritiusMexicoMiddle East & North AfricaMiddle East & North Africa (excluding high income)Middle East & North Africa (IDA & IBRD countries)Middle incomeMoldovaMonacoMongoliaMoroccoMozambiqueMyanmarNamibiaNauruNepalNetherlandsNew ZealandNicaraguaNigerNigeriaNorth AmericaNorwayOECD membersOmanOther small statesPacific island small statesPakistanPalauPanamaPapua New GuineaParaguayPeruPhilippinesPolandPortugalPost-demographic dividendPre-demographic dividendPuerto RicoQatarRomaniaRussian FederationRwandaSamoaSan MarinoSao Tome and PrincipeSaudi ArabiaSenegalSerbiaSeychellesSierra LeoneSingaporeSint Maarten (Dutch part)Slovak RepublicSloveniaSmall statesSolomon IslandsSomaliaSouth AfricaSouth AsiaSouth Asia (IDA & IBRD)South SudanSpainSri LankaSt. Kitts and NevisSt. LuciaSt. Vincent and the GrenadinesSub-Saharan Africa Sub-Saharan Africa (excluding high income)Sub-Saharan Africa (IDA & IBRD countries)SudanSurinameSwazilandSwedenSwitzerlandSyrian Arab RepublicTajikistanTanzaniaThailandTimor-LesteTogoTongaTrinidad and TobagoTunisiaTurkeyTurks and Caicos IslandsTuvaluUgandaUkraineUnited Arab EmiratesUnited KingdomUnited StatesUpper middle incomeUruguayUzbekistanVanuatuVenezuela, RBVietnamWest Bank and GazaWorldYemen, Rep.ZambiaZimbabwe Timeline:
This timeline shows a graph from 1971 to 2015 of Mauritius. No data until 1970. Number of actual observations by date: 43.
Source name:
World Development Indicators
Source organization:
United Nations Educational, Scientific, and Cultural Organization (UNESCO) Institute for Statistics.
Categories, topics:
Education, Gender
Last updated:
apr 23, 2017
Indicators value changes by year
Minimum:
40.312
jan 1, 1972
Maximum:
74.631
jan 1, 2015
At the date of observation
Value
Absolute change
Change from previous value
jan 1, 1971
41.344
+41.344
0.0%
jan 1, 1972
40.312
-1.033
-2.5%
jan 1, 1973
40.691
+0.379
0.94%
jan 1, 1974
40.432
-0.259
-0.64%
jan 1, 1975
40.625
+0.193
0.48%
jan 1, 1977
42.1
+1.475
3.63%
jan 1, 1978
42.773
+0.673
1.6%
jan 1, 1979
43.419
+0.647
1.51%
jan 1, 1980
41.952
-1.467
-3.38%
jan 1, 1981
43.424
+1.472
3.51%
jan 1, 1982
43.055
-0.369
-0.85%
jan 1, 1983
42.368
-0.688
-1.6%
jan 1, 1984
42.377
+0.009
0.02%
jan 1, 1985
42.459
+0.083
0.2%
jan 1, 1986
42.837
+0.378
0.89%
jan 1, 1987
42.897
+0.06
0.14%
jan 1, 1988
43.435
+0.537
1.25%
jan 1, 1989
43.816
+0.382
0.88%
jan 1, 1990
43.659
-0.157
-0.36%
jan 1, 1992
44.622
+0.963
2.21%
jan 1, 1993
46.046
+1.424
3.19%
jan 1, 1994
46.855
+0.81
1.76%
jan 1, 1995
48.623
+1.768
3.77%
jan 1, 1996
49.737
+1.114
2.29%
jan 1, 1997
51.275
+1.538
3.09%
jan 1, 1998
52.308
+1.033
2.01%
jan 1, 1999
53.149
+0.841
1.61%
jan 1, 2000
53.828
+0.679
1.28%
jan 1, 2001
55.079
+1.251
2.32%
jan 1, 2002
56.553
+1.474
2.68%
jan 1, 2003
57.287
+0.734
1.3%
jan 1, 2004
60.516
+3.229
5.64%
jan 1, 2005
61.766
+1.25
2.07%
jan 1, 2006
62.683
+0.917
1.48%
jan 1, 2007
64.38
+1.697
2.71%
jan 1, 2008
64.708
+0.328
0.51%
jan 1, 2009
66.442
+1.734
2.68%
jan 1, 2010
68.023
+1.581
2.38%
jan 1, 2011
69.846
+1.823
2.68%
jan 1, 2012
70.97
+1.124
1.61%
jan 1, 2013
72.158
+1.188
1.67%
jan 1, 2014
73.004
+0.847
1.17%
jan 1, 2015
74.631
+1.627
2.23%
Ranking of countries by current statistics by years


Comments: