29
/
en
AIzaSyAYiBZKx7MnpbEhh9jyipgxe19OcubqV5w
April 1, 2024
26842
Early-demographic dividend
EAR
false
2
1
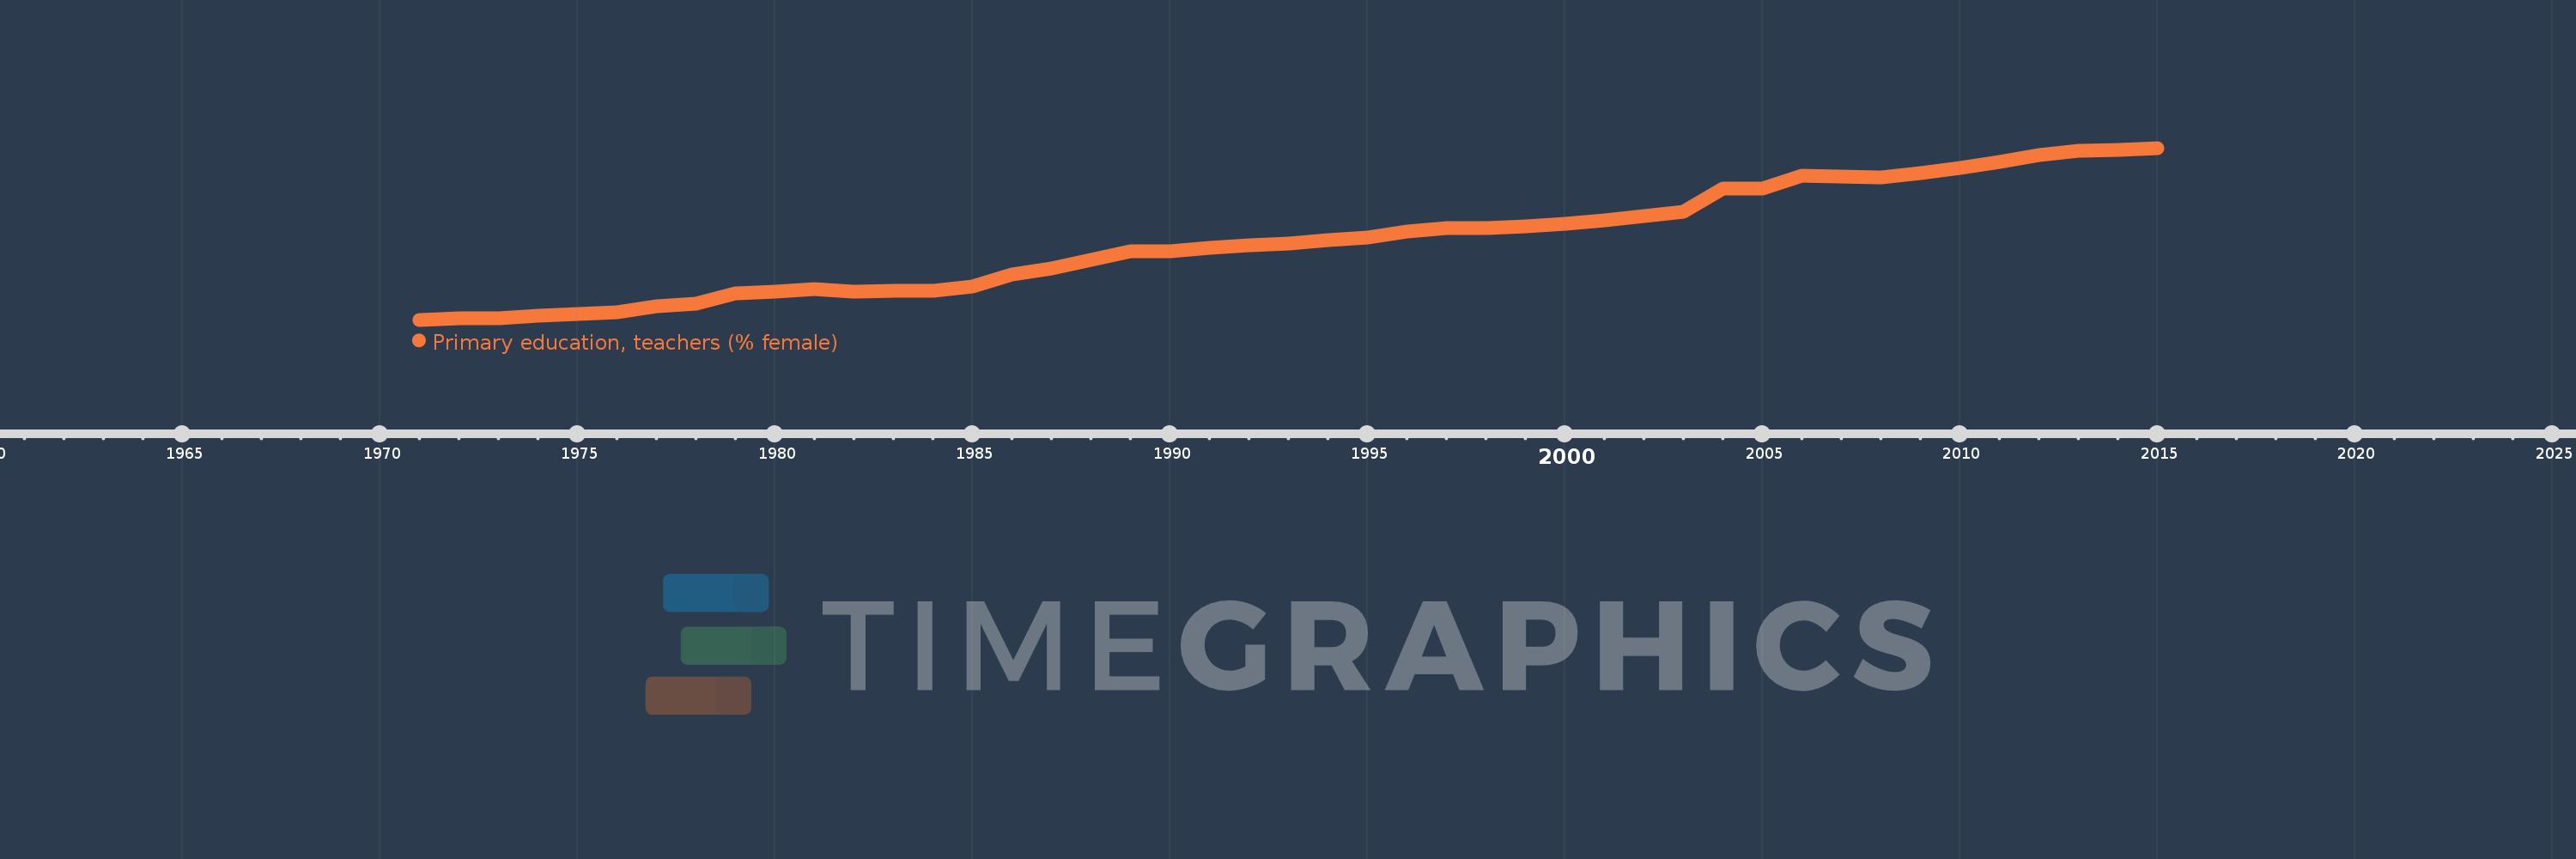
Primary education, teachers (% female)
2015,2014,2013,2012,2011,2010,2009,2008,2007,2006,2005,2004,2003,2002,2001,2000,1999,1998,1997,1996,1995,1994,1993,1992,1991,1990,1989,1988,1987,1986,1985,1984,1983,1982,1981,1980,1979,1978,1977,1976,1975,1974,1973,1972,1971
This statistics in other country:
AfghanistanAlbaniaAlgeriaAndorraAngolaAntigua and BarbudaArab WorldArgentinaArmeniaArubaAustraliaAustriaAzerbaijanBahamas, TheBahrainBangladeshBarbadosBelarusBelgiumBelizeBeninBermudaBhutanBoliviaBosnia and HerzegovinaBotswanaBrazilBritish Virgin IslandsBrunei DarussalamBulgariaBurkina FasoBurundiCabo VerdeCambodiaCameroonCanadaCaribbean small statesCayman IslandsCentral African RepublicCentral Europe and the BalticsChadChileChinaColombiaComorosCongo, Dem. Rep.Congo, Rep.Costa RicaCote d'IvoireCroatiaCubaCyprusCzech RepublicDenmarkDjiboutiDominicaDominican RepublicEarly-demographic dividendEast Asia & PacificEast Asia & Pacific (excluding high income)East Asia & Pacific (IDA & IBRD countries)EcuadorEgypt, Arab Rep.El SalvadorEquatorial GuineaEritreaEstoniaEthiopiaEuro areaEurope & Central AsiaEurope & Central Asia (excluding high income)Europe & Central Asia (IDA & IBRD countries)European UnionFijiFinlandFragile and conflict affected situationsFranceGabonGambia, TheGeorgiaGermanyGhanaGibraltarGreeceGrenadaGuatemalaGuineaGuinea-BissauGuyanaHaitiHeavily indebted poor countries (HIPC)High incomeHondurasHong Kong SAR, ChinaHungaryIBRD onlyIcelandIDA & IBRD totalIDA blendIDA onlyIDA totalIndiaIndonesiaIran, Islamic Rep.IraqIrelandIsraelItalyJamaicaJapanJordanKazakhstanKenyaKiribatiKorea, Dem. People’s Rep.Korea, Rep.KuwaitKyrgyz RepublicLao PDRLate-demographic dividendLatin America & Caribbean Latin America & Caribbean (excluding high income)Latin America & the Caribbean (IDA & IBRD countries)LatviaLeast developed countries: UN classificationLebanonLesothoLiberiaLibyaLiechtensteinLithuaniaLow & middle incomeLow incomeLower middle incomeLuxembourgMacao SAR, ChinaMacedonia, FYRMadagascarMalawiMalaysiaMaldivesMaliMaltaMarshall IslandsMauritaniaMauritiusMexicoMiddle East & North AfricaMiddle East & North Africa (excluding high income)Middle East & North Africa (IDA & IBRD countries)Middle incomeMoldovaMonacoMongoliaMoroccoMozambiqueMyanmarNamibiaNauruNepalNetherlandsNew ZealandNicaraguaNigerNigeriaNorth AmericaNorwayOECD membersOmanOther small statesPacific island small statesPakistanPalauPanamaPapua New GuineaParaguayPeruPhilippinesPolandPortugalPost-demographic dividendPre-demographic dividendPuerto RicoQatarRomaniaRussian FederationRwandaSamoaSan MarinoSao Tome and PrincipeSaudi ArabiaSenegalSerbiaSeychellesSierra LeoneSingaporeSint Maarten (Dutch part)Slovak RepublicSloveniaSmall statesSolomon IslandsSomaliaSouth AfricaSouth AsiaSouth Asia (IDA & IBRD)South SudanSpainSri LankaSt. Kitts and NevisSt. LuciaSt. Vincent and the GrenadinesSub-Saharan Africa Sub-Saharan Africa (excluding high income)Sub-Saharan Africa (IDA & IBRD countries)SudanSurinameSwazilandSwedenSwitzerlandSyrian Arab RepublicTajikistanTanzaniaThailandTimor-LesteTogoTongaTrinidad and TobagoTunisiaTurkeyTurks and Caicos IslandsTuvaluUgandaUkraineUnited Arab EmiratesUnited KingdomUnited StatesUpper middle incomeUruguayUzbekistanVanuatuVenezuela, RBVietnamWest Bank and GazaWorldYemen, Rep.ZambiaZimbabwe Timeline:
This timeline shows a graph from 1971 to 2015 of Early-demographic dividend. No data until 1970. Number of actual observations by date: 45.
Source name:
World Development Indicators
Source organization:
United Nations Educational, Scientific, and Cultural Organization (UNESCO) Institute for Statistics.
Categories, topics:
Education, Gender
Last updated:
apr 23, 2017
Indicators value changes by year
Minimum:
40.696
jan 1, 1971
Maximum:
58.055
jan 1, 2015
At the date of observation
Value
Absolute change
Change from previous value
jan 1, 1971
40.696
+40.696
0.0%
jan 1, 1972
40.821
+0.126
0.31%
jan 1, 1973
40.836
+0.015
0.04%
jan 1, 1974
41.091
+0.255
0.62%
jan 1, 1975
41.316
+0.224
0.55%
jan 1, 1976
41.413
+0.097
0.24%
jan 1, 1977
42.066
+0.653
1.58%
jan 1, 1978
42.31
+0.244
0.58%
jan 1, 1979
43.33
+1.021
2.41%
jan 1, 1980
43.508
+0.178
0.41%
jan 1, 1981
43.797
+0.289
0.67%
jan 1, 1982
43.558
-0.239
-0.55%
jan 1, 1983
43.644
+0.085
0.2%
jan 1, 1984
43.626
-0.018
-0.04%
jan 1, 1985
44.012
+0.386
0.88%
jan 1, 1986
45.249
+1.237
2.81%
jan 1, 1987
45.87
+0.621
1.37%
jan 1, 1988
46.774
+0.905
1.97%
jan 1, 1989
47.631
+0.857
1.83%
jan 1, 1990
47.639
+0.008
0.02%
jan 1, 1991
47.922
+0.283
0.59%
jan 1, 1992
48.214
+0.292
0.61%
jan 1, 1993
48.388
+0.174
0.36%
jan 1, 1994
48.711
+0.322
0.67%
jan 1, 1995
48.992
+0.281
0.58%
jan 1, 1996
49.649
+0.656
1.34%
jan 1, 1997
49.92
+0.272
0.55%
jan 1, 1998
49.963
+0.043
0.09%
jan 1, 1999
50.109
+0.145
0.29%
jan 1, 2000
50.431
+0.322
0.64%
jan 1, 2001
50.774
+0.344
0.68%
jan 1, 2002
51.155
+0.38
0.75%
jan 1, 2003
51.569
+0.414
0.81%
jan 1, 2004
53.979
+2.41
4.67%
jan 1, 2005
53.986
+0.007
0.01%
jan 1, 2006
55.239
+1.253
2.32%
jan 1, 2007
55.206
-0.033
-0.06%
jan 1, 2008
55.059
-0.146
-0.27%
jan 1, 2009
55.533
+0.473
0.86%
jan 1, 2010
56.037
+0.505
0.91%
jan 1, 2011
56.663
+0.625
1.12%
jan 1, 2012
57.366
+0.703
1.24%
jan 1, 2013
57.78
+0.414
0.72%
jan 1, 2014
57.879
+0.099
0.17%
jan 1, 2015
58.055
+0.176
0.3%
Ranking of countries by current statistics by years


Comments: