29
/
en
AIzaSyAYiBZKx7MnpbEhh9jyipgxe19OcubqV5w
April 1, 2024
32110
Europe & Central Asia (excluding high income)
ECA
false
2
1
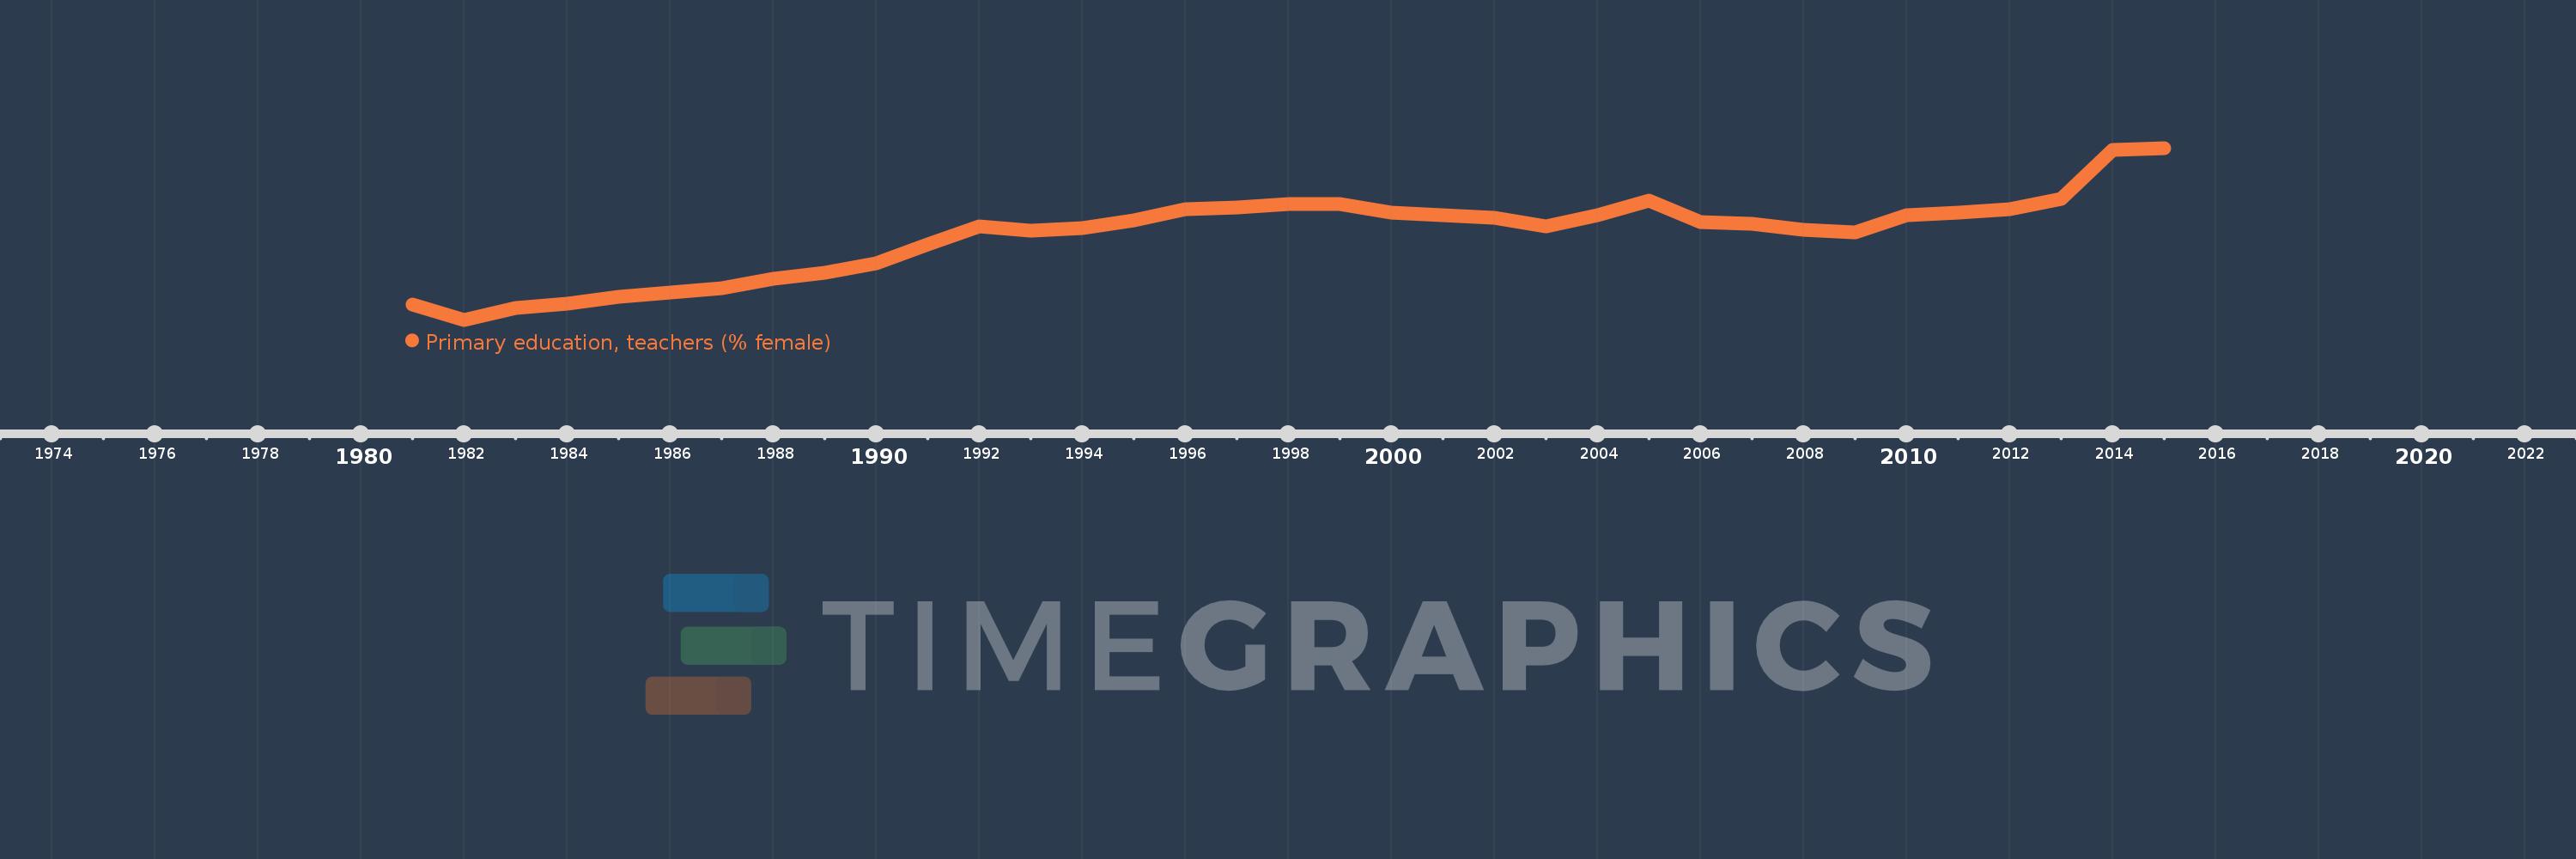
Primary education, teachers (% female)
2015,2014,2013,2012,2011,2010,2009,2008,2007,2006,2005,2004,2003,2002,2001,2000,1999,1998,1997,1996,1995,1994,1993,1992,1991,1990,1989,1988,1987,1986,1985,1984,1983,1982,1981
This statistics in other country:
AfghanistanAlbaniaAlgeriaAndorraAngolaAntigua and BarbudaArab WorldArgentinaArmeniaArubaAustraliaAustriaAzerbaijanBahamas, TheBahrainBangladeshBarbadosBelarusBelgiumBelizeBeninBermudaBhutanBoliviaBosnia and HerzegovinaBotswanaBrazilBritish Virgin IslandsBrunei DarussalamBulgariaBurkina FasoBurundiCabo VerdeCambodiaCameroonCanadaCaribbean small statesCayman IslandsCentral African RepublicCentral Europe and the BalticsChadChileChinaColombiaComorosCongo, Dem. Rep.Congo, Rep.Costa RicaCote d'IvoireCroatiaCubaCyprusCzech RepublicDenmarkDjiboutiDominicaDominican RepublicEarly-demographic dividendEast Asia & PacificEast Asia & Pacific (excluding high income)East Asia & Pacific (IDA & IBRD countries)EcuadorEgypt, Arab Rep.El SalvadorEquatorial GuineaEritreaEstoniaEthiopiaEuro areaEurope & Central AsiaEurope & Central Asia (excluding high income)Europe & Central Asia (IDA & IBRD countries)European UnionFijiFinlandFragile and conflict affected situationsFranceGabonGambia, TheGeorgiaGermanyGhanaGibraltarGreeceGrenadaGuatemalaGuineaGuinea-BissauGuyanaHaitiHeavily indebted poor countries (HIPC)High incomeHondurasHong Kong SAR, ChinaHungaryIBRD onlyIcelandIDA & IBRD totalIDA blendIDA onlyIDA totalIndiaIndonesiaIran, Islamic Rep.IraqIrelandIsraelItalyJamaicaJapanJordanKazakhstanKenyaKiribatiKorea, Dem. People’s Rep.Korea, Rep.KuwaitKyrgyz RepublicLao PDRLate-demographic dividendLatin America & Caribbean Latin America & Caribbean (excluding high income)Latin America & the Caribbean (IDA & IBRD countries)LatviaLeast developed countries: UN classificationLebanonLesothoLiberiaLibyaLiechtensteinLithuaniaLow & middle incomeLow incomeLower middle incomeLuxembourgMacao SAR, ChinaMacedonia, FYRMadagascarMalawiMalaysiaMaldivesMaliMaltaMarshall IslandsMauritaniaMauritiusMexicoMiddle East & North AfricaMiddle East & North Africa (excluding high income)Middle East & North Africa (IDA & IBRD countries)Middle incomeMoldovaMonacoMongoliaMoroccoMozambiqueMyanmarNamibiaNauruNepalNetherlandsNew ZealandNicaraguaNigerNigeriaNorth AmericaNorwayOECD membersOmanOther small statesPacific island small statesPakistanPalauPanamaPapua New GuineaParaguayPeruPhilippinesPolandPortugalPost-demographic dividendPre-demographic dividendPuerto RicoQatarRomaniaRussian FederationRwandaSamoaSan MarinoSao Tome and PrincipeSaudi ArabiaSenegalSerbiaSeychellesSierra LeoneSingaporeSint Maarten (Dutch part)Slovak RepublicSloveniaSmall statesSolomon IslandsSomaliaSouth AfricaSouth AsiaSouth Asia (IDA & IBRD)South SudanSpainSri LankaSt. Kitts and NevisSt. LuciaSt. Vincent and the GrenadinesSub-Saharan Africa Sub-Saharan Africa (excluding high income)Sub-Saharan Africa (IDA & IBRD countries)SudanSurinameSwazilandSwedenSwitzerlandSyrian Arab RepublicTajikistanTanzaniaThailandTimor-LesteTogoTongaTrinidad and TobagoTunisiaTurkeyTurks and Caicos IslandsTuvaluUgandaUkraineUnited Arab EmiratesUnited KingdomUnited StatesUpper middle incomeUruguayUzbekistanVanuatuVenezuela, RBVietnamWest Bank and GazaWorldYemen, Rep.ZambiaZimbabwe Timeline:
This timeline shows a graph from 1981 to 2015 of Europe & Central Asia (excluding high income). No data until 1980. Number of actual observations by date: 35.
Source name:
World Development Indicators
Source organization:
United Nations Educational, Scientific, and Cultural Organization (UNESCO) Institute for Statistics.
Categories, topics:
Education, Gender
Last updated:
apr 23, 2017
Indicators value changes by year
Minimum:
78.527
jan 1, 1982
Maximum:
85.096
jan 1, 2015
At the date of observation
Value
Absolute change
Change from previous value
jan 1, 1981
79.103
+79.103
0.0%
jan 1, 1982
78.527
-0.576
-0.73%
jan 1, 1983
78.963
+0.437
0.56%
jan 1, 1984
79.149
+0.186
0.24%
jan 1, 1985
79.401
+0.252
0.32%
jan 1, 1986
79.555
+0.153
0.19%
jan 1, 1987
79.734
+0.179
0.23%
jan 1, 1988
80.094
+0.36
0.45%
jan 1, 1989
80.331
+0.237
0.3%
jan 1, 1990
80.695
+0.364
0.45%
jan 1, 1991
81.407
+0.712
0.88%
jan 1, 1992
82.097
+0.691
0.85%
jan 1, 1993
81.924
-0.173
-0.21%
jan 1, 1994
82.036
+0.112
0.14%
jan 1, 1995
82.327
+0.291
0.36%
jan 1, 1996
82.754
+0.426
0.52%
jan 1, 1997
82.807
+0.053
0.06%
jan 1, 1998
82.935
+0.128
0.15%
jan 1, 1999
82.957
+0.022
0.03%
jan 1, 2000
82.627
-0.329
-0.4%
jan 1, 2001
82.522
-0.105
-0.13%
jan 1, 2002
82.412
-0.111
-0.13%
jan 1, 2003
82.094
-0.317
-0.39%
jan 1, 2004
82.521
+0.427
0.52%
jan 1, 2005
83.071
+0.55
0.67%
jan 1, 2006
82.271
-0.801
-0.96%
jan 1, 2007
82.204
-0.067
-0.08%
jan 1, 2008
81.951
-0.252
-0.31%
jan 1, 2009
81.874
-0.078
-0.09%
jan 1, 2010
82.53
+0.657
0.8%
jan 1, 2011
82.609
+0.079
0.1%
jan 1, 2012
82.747
+0.137
0.17%
jan 1, 2013
83.149
+0.402
0.49%
jan 1, 2014
85.018
+1.869
2.25%
jan 1, 2015
85.096
+0.078
0.09%
Ranking of countries by current statistics by years


Comments: