29
/
en
AIzaSyAYiBZKx7MnpbEhh9jyipgxe19OcubqV5w
April 1, 2024
170418
Korea, Rep.
KOR
true
2
1
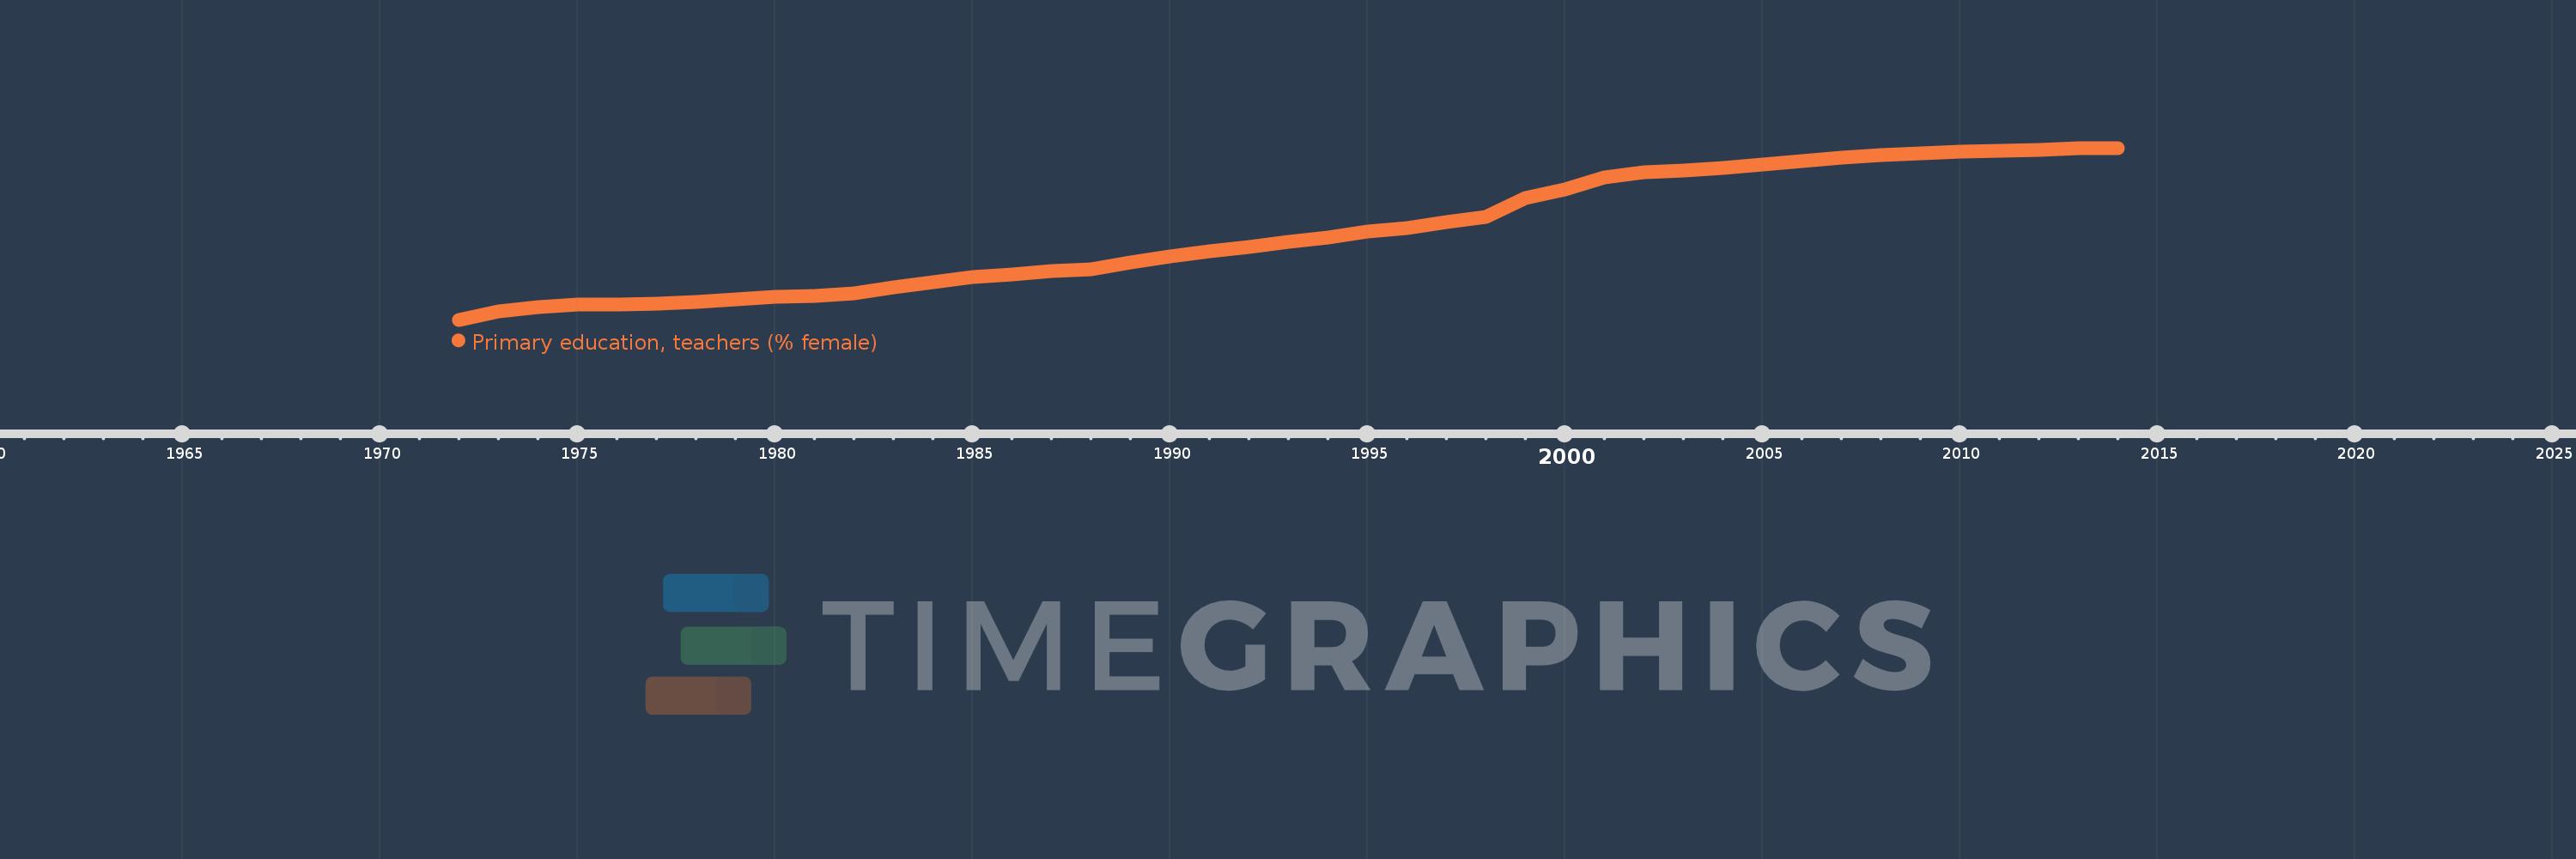
Primary education, teachers (% female)
2014,2013,2012,2011,2010,2009,2008,2007,2006,2005,2004,2003,2002,2001,2000,1999,1998,1997,1996,1995,1994,1993,1992,1991,1990,1989,1988,1987,1986,1985,1984,1983,1982,1981,1980,1979,1978,1977,1976,1975,1974,1973,1972
This statistics in other country:
AfghanistanAlbaniaAlgeriaAndorraAngolaAntigua and BarbudaArab WorldArgentinaArmeniaArubaAustraliaAustriaAzerbaijanBahamas, TheBahrainBangladeshBarbadosBelarusBelgiumBelizeBeninBermudaBhutanBoliviaBosnia and HerzegovinaBotswanaBrazilBritish Virgin IslandsBrunei DarussalamBulgariaBurkina FasoBurundiCabo VerdeCambodiaCameroonCanadaCaribbean small statesCayman IslandsCentral African RepublicCentral Europe and the BalticsChadChileChinaColombiaComorosCongo, Dem. Rep.Congo, Rep.Costa RicaCote d'IvoireCroatiaCubaCyprusCzech RepublicDenmarkDjiboutiDominicaDominican RepublicEarly-demographic dividendEast Asia & PacificEast Asia & Pacific (excluding high income)East Asia & Pacific (IDA & IBRD countries)EcuadorEgypt, Arab Rep.El SalvadorEquatorial GuineaEritreaEstoniaEthiopiaEuro areaEurope & Central AsiaEurope & Central Asia (excluding high income)Europe & Central Asia (IDA & IBRD countries)European UnionFijiFinlandFragile and conflict affected situationsFranceGabonGambia, TheGeorgiaGermanyGhanaGibraltarGreeceGrenadaGuatemalaGuineaGuinea-BissauGuyanaHaitiHeavily indebted poor countries (HIPC)High incomeHondurasHong Kong SAR, ChinaHungaryIBRD onlyIcelandIDA & IBRD totalIDA blendIDA onlyIDA totalIndiaIndonesiaIran, Islamic Rep.IraqIrelandIsraelItalyJamaicaJapanJordanKazakhstanKenyaKiribatiKorea, Dem. People’s Rep.Korea, Rep.KuwaitKyrgyz RepublicLao PDRLate-demographic dividendLatin America & Caribbean Latin America & Caribbean (excluding high income)Latin America & the Caribbean (IDA & IBRD countries)LatviaLeast developed countries: UN classificationLebanonLesothoLiberiaLibyaLiechtensteinLithuaniaLow & middle incomeLow incomeLower middle incomeLuxembourgMacao SAR, ChinaMacedonia, FYRMadagascarMalawiMalaysiaMaldivesMaliMaltaMarshall IslandsMauritaniaMauritiusMexicoMiddle East & North AfricaMiddle East & North Africa (excluding high income)Middle East & North Africa (IDA & IBRD countries)Middle incomeMoldovaMonacoMongoliaMoroccoMozambiqueMyanmarNamibiaNauruNepalNetherlandsNew ZealandNicaraguaNigerNigeriaNorth AmericaNorwayOECD membersOmanOther small statesPacific island small statesPakistanPalauPanamaPapua New GuineaParaguayPeruPhilippinesPolandPortugalPost-demographic dividendPre-demographic dividendPuerto RicoQatarRomaniaRussian FederationRwandaSamoaSan MarinoSao Tome and PrincipeSaudi ArabiaSenegalSerbiaSeychellesSierra LeoneSingaporeSint Maarten (Dutch part)Slovak RepublicSloveniaSmall statesSolomon IslandsSomaliaSouth AfricaSouth AsiaSouth Asia (IDA & IBRD)South SudanSpainSri LankaSt. Kitts and NevisSt. LuciaSt. Vincent and the GrenadinesSub-Saharan Africa Sub-Saharan Africa (excluding high income)Sub-Saharan Africa (IDA & IBRD countries)SudanSurinameSwazilandSwedenSwitzerlandSyrian Arab RepublicTajikistanTanzaniaThailandTimor-LesteTogoTongaTrinidad and TobagoTunisiaTurkeyTurks and Caicos IslandsTuvaluUgandaUkraineUnited Arab EmiratesUnited KingdomUnited StatesUpper middle incomeUruguayUzbekistanVanuatuVenezuela, RBVietnamWest Bank and GazaWorldYemen, Rep.ZambiaZimbabwe Timeline:
This timeline shows a graph from 1972 to 2014 of Korea, Rep.. No data until 1971. Number of actual observations by date: 43.
Source name:
World Development Indicators
Source organization:
United Nations Educational, Scientific, and Cultural Organization (UNESCO) Institute for Statistics.
Categories, topics:
Education, Gender
Last updated:
apr 23, 2017
Indicators value changes by year
Minimum:
29.109
jan 1, 1972
Maximum:
78.702
jan 1, 2013
At the date of observation
Value
Absolute change
Change from previous value
jan 1, 1972
29.109
+29.109
0.0%
jan 1, 1973
31.525
+2.416
8.3%
jan 1, 1974
32.827
+1.302
4.13%
jan 1, 1975
33.42
+0.593
1.81%
jan 1, 1976
33.613
+0.193
0.58%
jan 1, 1977
33.701
+0.089
0.26%
jan 1, 1978
34.154
+0.453
1.34%
jan 1, 1979
35.044
+0.89
2.61%
jan 1, 1980
35.611
+0.567
1.62%
jan 1, 1981
36.044
+0.433
1.22%
jan 1, 1982
36.78
+0.736
2.04%
jan 1, 1983
38.484
+1.704
4.63%
jan 1, 1984
39.913
+1.429
3.71%
jan 1, 1985
41.315
+1.402
3.51%
jan 1, 1986
42.111
+0.796
1.93%
jan 1, 1987
43.065
+0.954
2.27%
jan 1, 1988
43.702
+0.637
1.48%
jan 1, 1989
45.656
+1.953
4.47%
jan 1, 1990
47.314
+1.659
3.63%
jan 1, 1991
48.748
+1.434
3.03%
jan 1, 1992
50.149
+1.401
2.87%
jan 1, 1993
51.608
+1.459
2.91%
jan 1, 1994
52.718
+1.11
2.15%
jan 1, 1995
54.529
+1.811
3.44%
jan 1, 1996
55.616
+1.087
1.99%
jan 1, 1997
57.19
+1.574
2.83%
jan 1, 1998
58.693
+1.502
2.63%
jan 1, 1999
64.317
+5.624
9.58%
jan 1, 2000
66.807
+2.49
3.87%
jan 1, 2001
70.302
+3.496
5.23%
jan 1, 2002
71.572
+1.27
1.81%
jan 1, 2003
72.218
+0.646
0.9%
jan 1, 2004
72.974
+0.756
1.05%
jan 1, 2005
73.979
+1.006
1.38%
jan 1, 2006
74.956
+0.977
1.32%
jan 1, 2007
75.917
+0.961
1.28%
jan 1, 2008
76.553
+0.636
0.84%
jan 1, 2009
77.212
+0.658
0.86%
jan 1, 2010
77.532
+0.32
0.41%
jan 1, 2011
77.872
+0.34
0.44%
jan 1, 2012
78.245
+0.374
0.48%
jan 1, 2013
78.702
+0.457
0.58%
jan 1, 2014
78.639
-0.063
-0.08%
Ranking of countries by current statistics by years


Comments: