29
/
en
AIzaSyAYiBZKx7MnpbEhh9jyipgxe19OcubqV5w
April 1, 2024
275159
United Arab Emirates
ARE
true
2
1
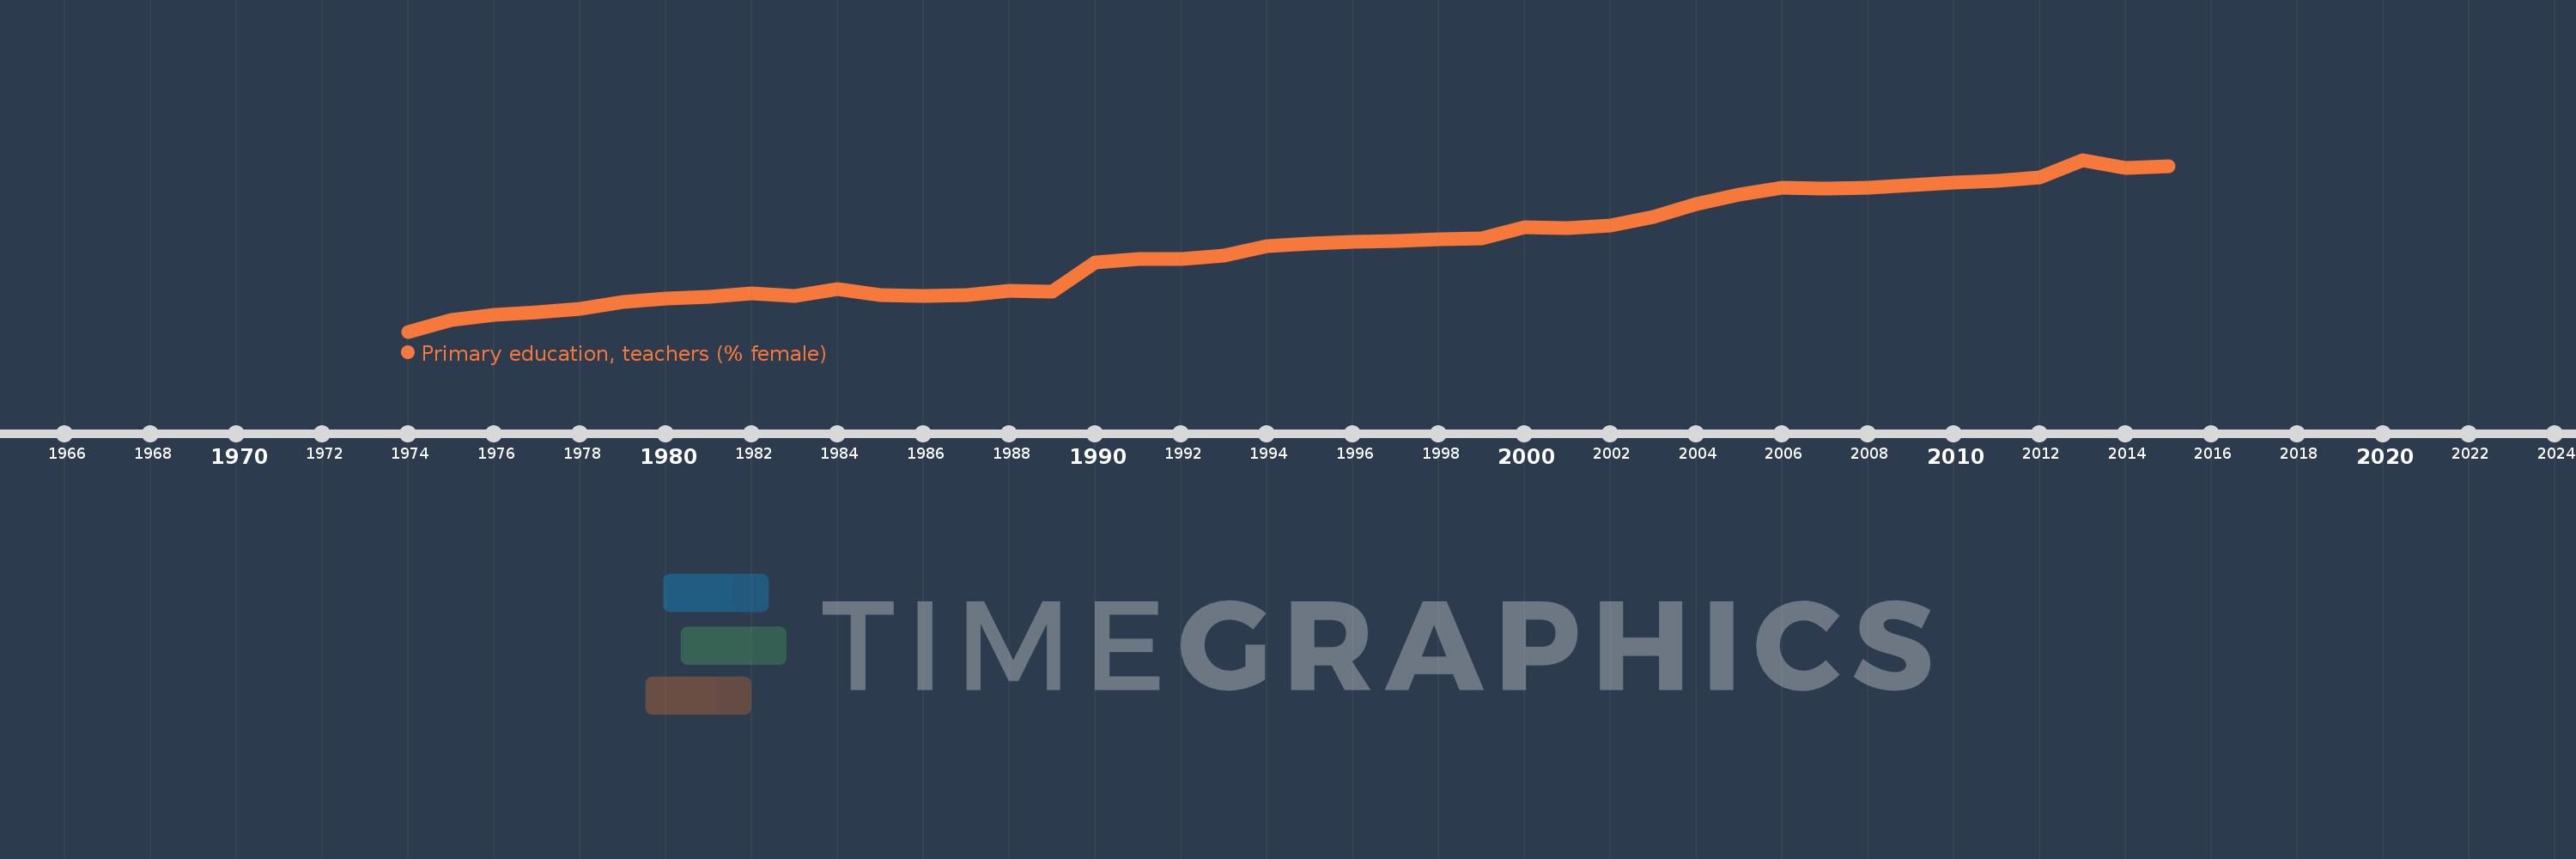
Primary education, teachers (% female)
2015,2014,2013,2012,2011,2010,2008,2007,2006,2005,2004,2003,2002,2001,2000,1999,1998,1997,1996,1995,1994,1993,1992,1991,1990,1989,1988,1987,1986,1985,1984,1983,1982,1981,1980,1979,1978,1977,1976,1975,1974
This statistics in other country:
AfghanistanAlbaniaAlgeriaAndorraAngolaAntigua and BarbudaArab WorldArgentinaArmeniaArubaAustraliaAustriaAzerbaijanBahamas, TheBahrainBangladeshBarbadosBelarusBelgiumBelizeBeninBermudaBhutanBoliviaBosnia and HerzegovinaBotswanaBrazilBritish Virgin IslandsBrunei DarussalamBulgariaBurkina FasoBurundiCabo VerdeCambodiaCameroonCanadaCaribbean small statesCayman IslandsCentral African RepublicCentral Europe and the BalticsChadChileChinaColombiaComorosCongo, Dem. Rep.Congo, Rep.Costa RicaCote d'IvoireCroatiaCubaCyprusCzech RepublicDenmarkDjiboutiDominicaDominican RepublicEarly-demographic dividendEast Asia & PacificEast Asia & Pacific (excluding high income)East Asia & Pacific (IDA & IBRD countries)EcuadorEgypt, Arab Rep.El SalvadorEquatorial GuineaEritreaEstoniaEthiopiaEuro areaEurope & Central AsiaEurope & Central Asia (excluding high income)Europe & Central Asia (IDA & IBRD countries)European UnionFijiFinlandFragile and conflict affected situationsFranceGabonGambia, TheGeorgiaGermanyGhanaGibraltarGreeceGrenadaGuatemalaGuineaGuinea-BissauGuyanaHaitiHeavily indebted poor countries (HIPC)High incomeHondurasHong Kong SAR, ChinaHungaryIBRD onlyIcelandIDA & IBRD totalIDA blendIDA onlyIDA totalIndiaIndonesiaIran, Islamic Rep.IraqIrelandIsraelItalyJamaicaJapanJordanKazakhstanKenyaKiribatiKorea, Dem. People’s Rep.Korea, Rep.KuwaitKyrgyz RepublicLao PDRLate-demographic dividendLatin America & Caribbean Latin America & Caribbean (excluding high income)Latin America & the Caribbean (IDA & IBRD countries)LatviaLeast developed countries: UN classificationLebanonLesothoLiberiaLibyaLiechtensteinLithuaniaLow & middle incomeLow incomeLower middle incomeLuxembourgMacao SAR, ChinaMacedonia, FYRMadagascarMalawiMalaysiaMaldivesMaliMaltaMarshall IslandsMauritaniaMauritiusMexicoMiddle East & North AfricaMiddle East & North Africa (excluding high income)Middle East & North Africa (IDA & IBRD countries)Middle incomeMoldovaMonacoMongoliaMoroccoMozambiqueMyanmarNamibiaNauruNepalNetherlandsNew ZealandNicaraguaNigerNigeriaNorth AmericaNorwayOECD membersOmanOther small statesPacific island small statesPakistanPalauPanamaPapua New GuineaParaguayPeruPhilippinesPolandPortugalPost-demographic dividendPre-demographic dividendPuerto RicoQatarRomaniaRussian FederationRwandaSamoaSan MarinoSao Tome and PrincipeSaudi ArabiaSenegalSerbiaSeychellesSierra LeoneSingaporeSint Maarten (Dutch part)Slovak RepublicSloveniaSmall statesSolomon IslandsSomaliaSouth AfricaSouth AsiaSouth Asia (IDA & IBRD)South SudanSpainSri LankaSt. Kitts and NevisSt. LuciaSt. Vincent and the GrenadinesSub-Saharan Africa Sub-Saharan Africa (excluding high income)Sub-Saharan Africa (IDA & IBRD countries)SudanSurinameSwazilandSwedenSwitzerlandSyrian Arab RepublicTajikistanTanzaniaThailandTimor-LesteTogoTongaTrinidad and TobagoTunisiaTurkeyTurks and Caicos IslandsTuvaluUgandaUkraineUnited Arab EmiratesUnited KingdomUnited StatesUpper middle incomeUruguayUzbekistanVanuatuVenezuela, RBVietnamWest Bank and GazaWorldYemen, Rep.ZambiaZimbabwe Timeline:
This timeline shows a graph from 1974 to 2015 of United Arab Emirates. No data until 1973. Number of actual observations by date: 41.
Source name:
World Development Indicators
Source organization:
United Nations Educational, Scientific, and Cultural Organization (UNESCO) Institute for Statistics.
Categories, topics:
Education, Gender
Last updated:
apr 23, 2017
Indicators value changes by year
Minimum:
43.593
jan 1, 1974
Maximum:
92.407
jan 1, 2013
At the date of observation
Value
Absolute change
Change from previous value
jan 1, 1974
43.593
+43.593
0.0%
jan 1, 1975
46.884
+3.291
7.55%
jan 1, 1976
48.442
+1.557
3.32%
jan 1, 1977
48.982
+0.54
1.11%
jan 1, 1978
49.974
+0.993
2.03%
jan 1, 1979
51.974
+2.0
4.0%
jan 1, 1980
52.906
+0.932
1.79%
jan 1, 1981
53.465
+0.56
1.06%
jan 1, 1982
54.369
+0.904
1.69%
jan 1, 1983
53.783
-0.587
-1.08%
jan 1, 1984
55.558
+1.775
3.3%
jan 1, 1985
53.922
-1.636
-2.94%
jan 1, 1986
53.699
-0.223
-0.41%
jan 1, 1987
54.058
+0.36
0.67%
jan 1, 1988
55.189
+1.131
2.09%
jan 1, 1989
54.931
-0.258
-0.47%
jan 1, 1990
63.18
+8.25
15.02%
jan 1, 1991
64.156
+0.975
1.54%
jan 1, 1992
64.258
+0.103
0.16%
jan 1, 1993
65.089
+0.83
1.29%
jan 1, 1994
67.791
+2.702
4.15%
jan 1, 1995
68.68
+0.889
1.31%
jan 1, 1996
69.066
+0.386
0.56%
jan 1, 1997
69.364
+0.298
0.43%
jan 1, 1998
69.718
+0.353
0.51%
jan 1, 1999
70.138
+0.421
0.6%
jan 1, 2000
73.367
+3.229
4.6%
jan 1, 2001
73.02
-0.348
-0.47%
jan 1, 2002
73.841
+0.821
1.12%
jan 1, 2003
76.235
+2.394
3.24%
jan 1, 2004
79.875
+3.64
4.77%
jan 1, 2005
82.594
+2.719
3.4%
jan 1, 2006
84.422
+1.828
2.21%
jan 1, 2007
84.218
-0.204
-0.24%
jan 1, 2008
84.5
+0.282
0.34%
jan 1, 2010
85.869
+1.368
1.62%
jan 1, 2011
86.413
+0.544
0.63%
jan 1, 2012
87.342
+0.929
1.08%
jan 1, 2013
92.407
+5.065
5.8%
jan 1, 2014
90.158
-2.249
-2.43%
jan 1, 2015
90.69
+0.532
0.59%
Ranking of countries by current statistics by years


Comments: