29
/
en
AIzaSyAYiBZKx7MnpbEhh9jyipgxe19OcubqV5w
April 1, 2024
211001
Nicaragua
NIC
true
2
1
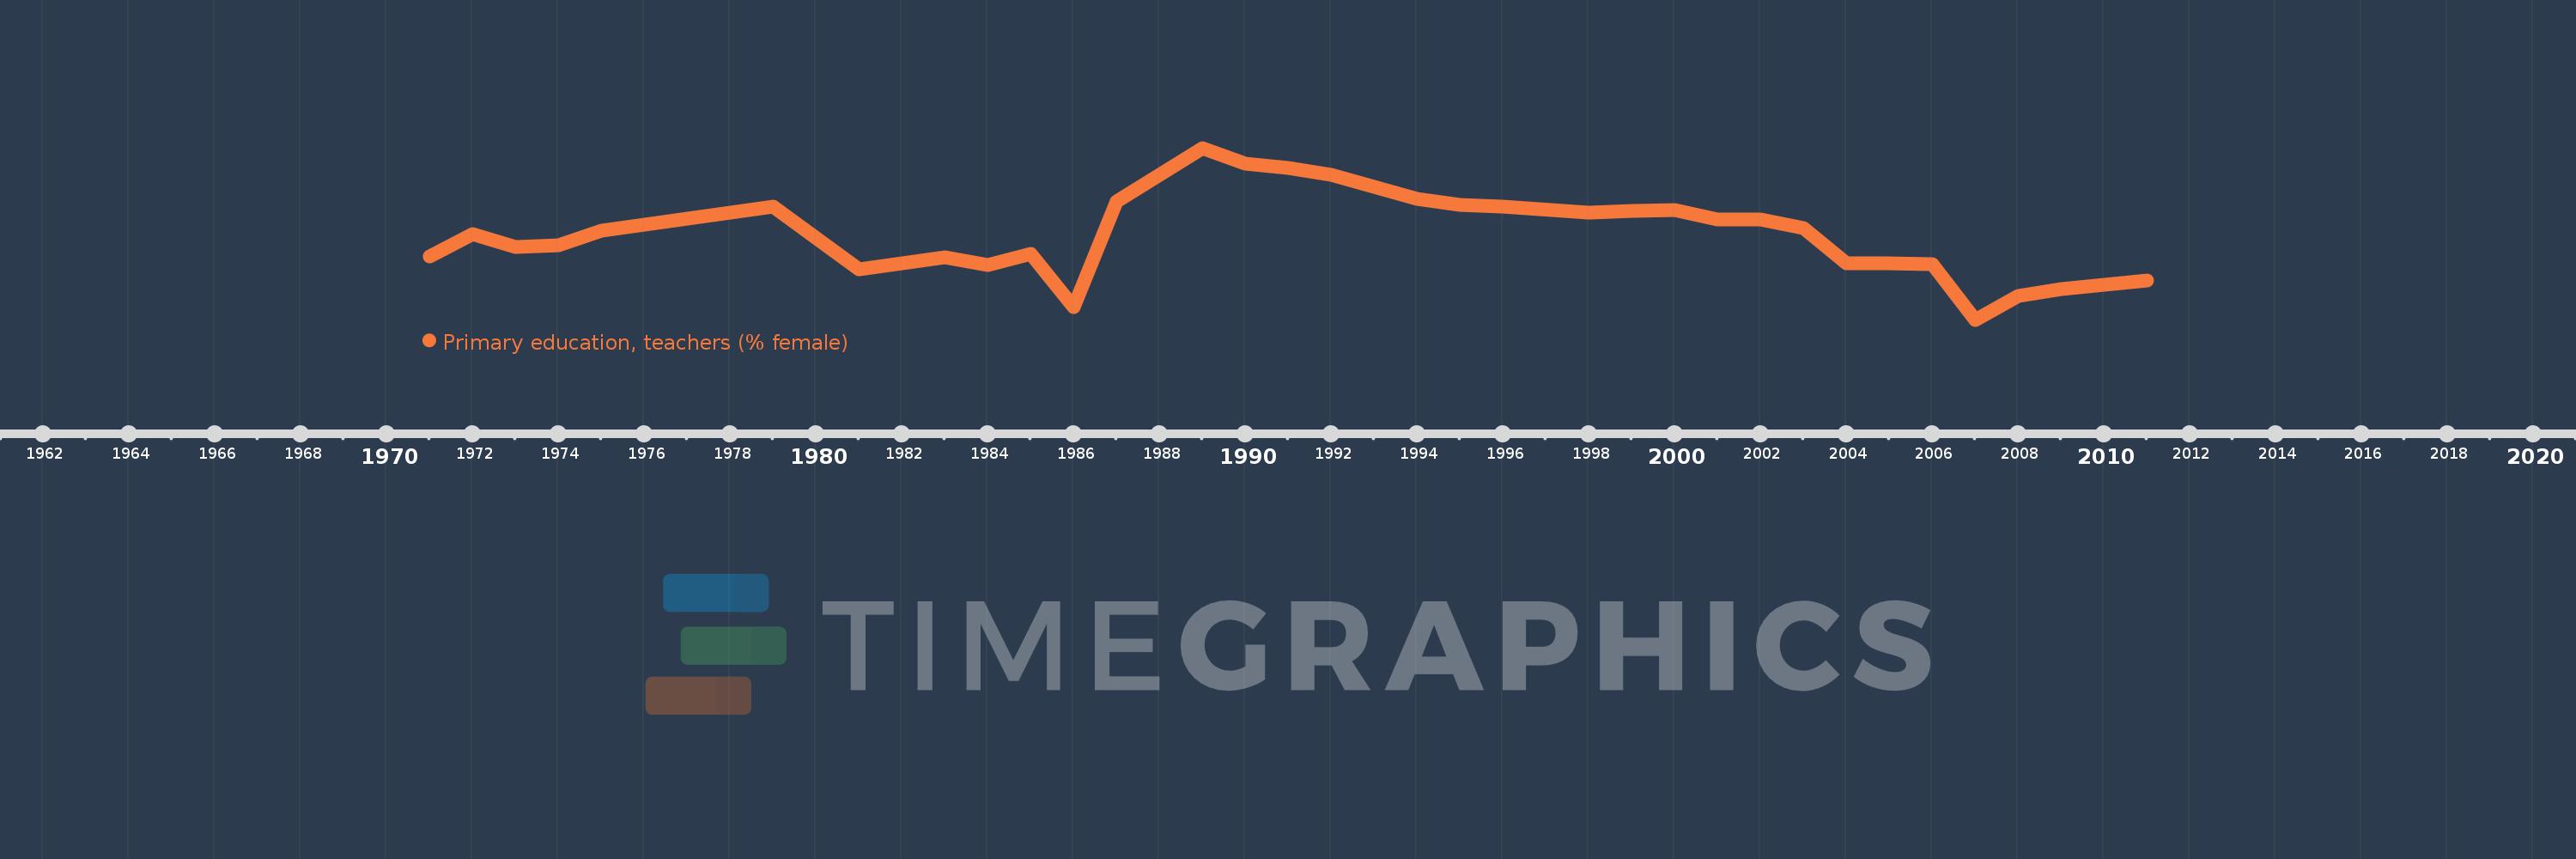
Primary education, teachers (% female)
2011,2009,2008,2007,2006,2005,2004,2003,2002,2001,2000,1999,1998,1996,1995,1994,1992,1991,1990,1989,1988,1987,1986,1985,1984,1983,1981,1979,1975,1974,1973,1972,1971
This statistics in other country:
AfghanistanAlbaniaAlgeriaAndorraAngolaAntigua and BarbudaArab WorldArgentinaArmeniaArubaAustraliaAustriaAzerbaijanBahamas, TheBahrainBangladeshBarbadosBelarusBelgiumBelizeBeninBermudaBhutanBoliviaBosnia and HerzegovinaBotswanaBrazilBritish Virgin IslandsBrunei DarussalamBulgariaBurkina FasoBurundiCabo VerdeCambodiaCameroonCanadaCaribbean small statesCayman IslandsCentral African RepublicCentral Europe and the BalticsChadChileChinaColombiaComorosCongo, Dem. Rep.Congo, Rep.Costa RicaCote d'IvoireCroatiaCubaCyprusCzech RepublicDenmarkDjiboutiDominicaDominican RepublicEarly-demographic dividendEast Asia & PacificEast Asia & Pacific (excluding high income)East Asia & Pacific (IDA & IBRD countries)EcuadorEgypt, Arab Rep.El SalvadorEquatorial GuineaEritreaEstoniaEthiopiaEuro areaEurope & Central AsiaEurope & Central Asia (excluding high income)Europe & Central Asia (IDA & IBRD countries)European UnionFijiFinlandFragile and conflict affected situationsFranceGabonGambia, TheGeorgiaGermanyGhanaGibraltarGreeceGrenadaGuatemalaGuineaGuinea-BissauGuyanaHaitiHeavily indebted poor countries (HIPC)High incomeHondurasHong Kong SAR, ChinaHungaryIBRD onlyIcelandIDA & IBRD totalIDA blendIDA onlyIDA totalIndiaIndonesiaIran, Islamic Rep.IraqIrelandIsraelItalyJamaicaJapanJordanKazakhstanKenyaKiribatiKorea, Dem. People’s Rep.Korea, Rep.KuwaitKyrgyz RepublicLao PDRLate-demographic dividendLatin America & Caribbean Latin America & Caribbean (excluding high income)Latin America & the Caribbean (IDA & IBRD countries)LatviaLeast developed countries: UN classificationLebanonLesothoLiberiaLibyaLiechtensteinLithuaniaLow & middle incomeLow incomeLower middle incomeLuxembourgMacao SAR, ChinaMacedonia, FYRMadagascarMalawiMalaysiaMaldivesMaliMaltaMarshall IslandsMauritaniaMauritiusMexicoMiddle East & North AfricaMiddle East & North Africa (excluding high income)Middle East & North Africa (IDA & IBRD countries)Middle incomeMoldovaMonacoMongoliaMoroccoMozambiqueMyanmarNamibiaNauruNepalNetherlandsNew ZealandNicaraguaNigerNigeriaNorth AmericaNorwayOECD membersOmanOther small statesPacific island small statesPakistanPalauPanamaPapua New GuineaParaguayPeruPhilippinesPolandPortugalPost-demographic dividendPre-demographic dividendPuerto RicoQatarRomaniaRussian FederationRwandaSamoaSan MarinoSao Tome and PrincipeSaudi ArabiaSenegalSerbiaSeychellesSierra LeoneSingaporeSint Maarten (Dutch part)Slovak RepublicSloveniaSmall statesSolomon IslandsSomaliaSouth AfricaSouth AsiaSouth Asia (IDA & IBRD)South SudanSpainSri LankaSt. Kitts and NevisSt. LuciaSt. Vincent and the GrenadinesSub-Saharan Africa Sub-Saharan Africa (excluding high income)Sub-Saharan Africa (IDA & IBRD countries)SudanSurinameSwazilandSwedenSwitzerlandSyrian Arab RepublicTajikistanTanzaniaThailandTimor-LesteTogoTongaTrinidad and TobagoTunisiaTurkeyTurks and Caicos IslandsTuvaluUgandaUkraineUnited Arab EmiratesUnited KingdomUnited StatesUpper middle incomeUruguayUzbekistanVanuatuVenezuela, RBVietnamWest Bank and GazaWorldYemen, Rep.ZambiaZimbabwe Timeline:
This timeline shows a graph from 1971 to 2011 of Nicaragua. No data until 1970. Number of actual observations by date: 33.
Source name:
World Development Indicators
Source organization:
United Nations Educational, Scientific, and Cultural Organization (UNESCO) Institute for Statistics.
Categories, topics:
Education, Gender
Last updated:
apr 23, 2017
Indicators value changes by year
Minimum:
73.546
jan 1, 2007
Maximum:
88.708
jan 1, 1989
At the date of observation
Value
Absolute change
Change from previous value
jan 1, 1971
79.097
+79.097
0.0%
jan 1, 1972
81.075
+1.978
2.5%
jan 1, 1973
79.985
-1.09
-1.34%
jan 1, 1974
80.111
+0.126
0.16%
jan 1, 1975
81.387
+1.276
1.59%
jan 1, 1979
83.507
+2.12
2.6%
jan 1, 1981
78.022
-5.485
-6.57%
jan 1, 1983
79.071
+1.049
1.34%
jan 1, 1984
78.374
-0.697
-0.88%
jan 1, 1985
79.355
+0.981
1.25%
jan 1, 1986
74.65
-4.705
-5.93%
jan 1, 1987
83.987
+9.337
12.51%
jan 1, 1988
86.326
+2.339
2.78%
jan 1, 1989
88.708
+2.382
2.76%
jan 1, 1990
87.309
-1.399
-1.58%
jan 1, 1991
86.905
-0.405
-0.46%
jan 1, 1992
86.33
-0.575
-0.66%
jan 1, 1994
84.206
-2.123
-2.46%
jan 1, 1995
83.657
-0.55
-0.65%
jan 1, 1996
83.501
-0.156
-0.19%
jan 1, 1998
82.983
-0.518
-0.62%
jan 1, 1999
83.13
+0.147
0.18%
jan 1, 2000
83.242
+0.112
0.14%
jan 1, 2001
82.386
-0.856
-1.03%
jan 1, 2002
82.392
+0.006
0.01%
jan 1, 2003
81.614
-0.779
-0.94%
jan 1, 2004
78.527
-3.087
-3.78%
jan 1, 2005
78.527
0.0
0.0%
jan 1, 2006
78.472
-0.055
-0.07%
jan 1, 2007
73.546
-4.926
-6.28%
jan 1, 2008
75.68
+2.134
2.9%
jan 1, 2009
76.259
+0.579
0.77%
jan 1, 2011
77.021
+0.762
1.0%
Ranking of countries by current statistics by years


Comments: