29
/
en
AIzaSyAYiBZKx7MnpbEhh9jyipgxe19OcubqV5w
April 1, 2024
276738
United States
USA
true
2
1
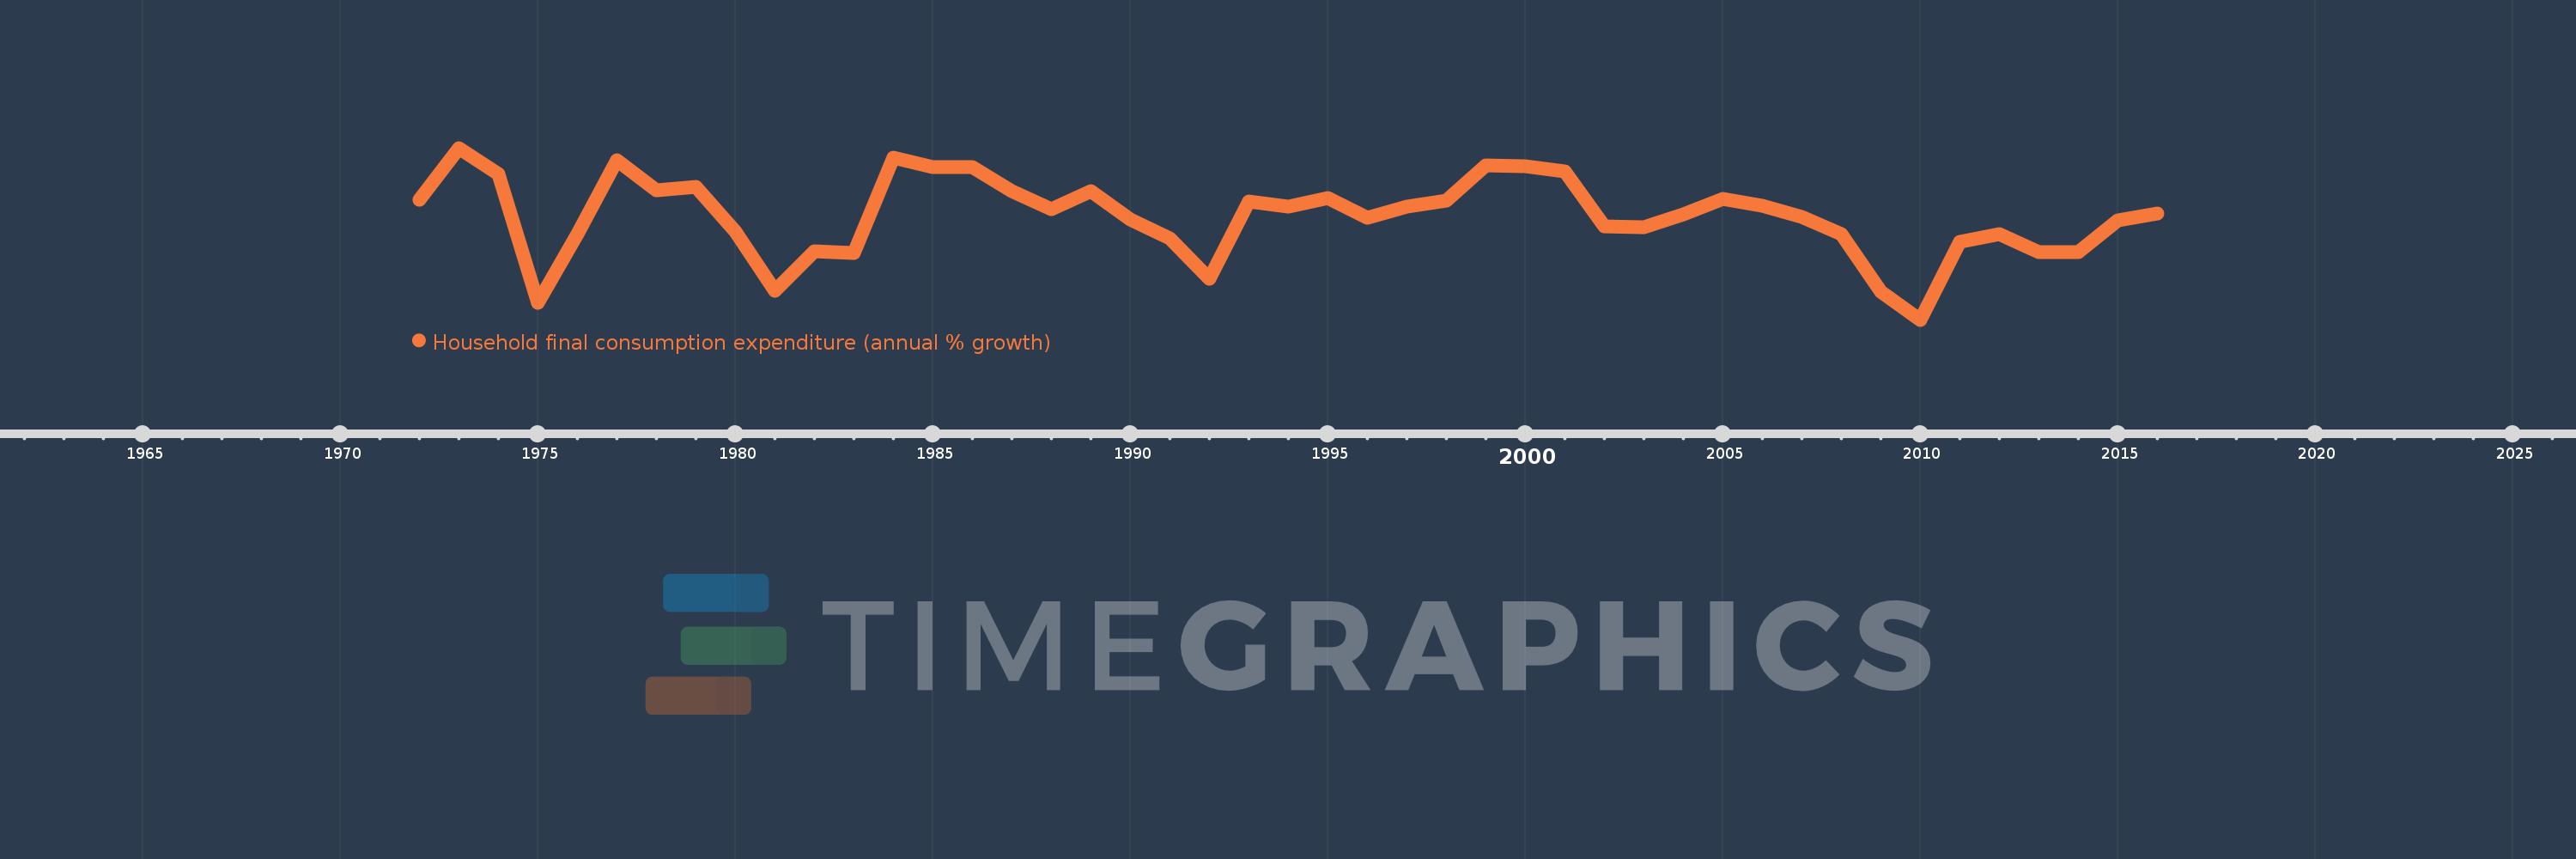
Household final consumption expenditure (annual % growth)
2016,2015,2014,2013,2012,2011,2010,2009,2008,2007,2006,2005,2004,2003,2002,2001,2000,1999,1998,1997,1996,1995,1994,1993,1992,1991,1990,1989,1988,1987,1986,1985,1984,1983,1982,1981,1980,1979,1978,1977,1976,1975,1974,1973,1972
This statistics in other country:
AlbaniaAlgeriaAntigua and BarbudaArab WorldArgentinaArmeniaAustraliaAustriaAzerbaijanBahamas, TheBahrainBangladeshBarbadosBelarusBelgiumBelizeBeninBhutanBoliviaBosnia and HerzegovinaBotswanaBrazilBrunei DarussalamBulgariaBurkina FasoBurundiCabo VerdeCambodiaCameroonCanadaCaribbean small statesCentral Europe and the BalticsChadChileChinaColombiaComorosCongo, Dem. Rep.Congo, Rep.Costa RicaCote d'IvoireCroatiaCubaCyprusCzech RepublicDenmarkDominican RepublicEarly-demographic dividendEast Asia & PacificEast Asia & Pacific (excluding high income)East Asia & Pacific (IDA & IBRD countries)EcuadorEgypt, Arab Rep.El SalvadorEquatorial GuineaEritreaEstoniaEthiopiaEuro areaEurope & Central AsiaEurope & Central Asia (excluding high income)Europe & Central Asia (IDA & IBRD countries)European UnionFinlandFranceGabonGambia, TheGeorgiaGermanyGhanaGreeceGuatemalaGuineaGuinea-BissauHaitiHeavily indebted poor countries (HIPC)High incomeHondurasHong Kong SAR, ChinaHungaryIBRD onlyIcelandIDA & IBRD totalIDA blendIDA onlyIDA totalIndiaIndonesiaIran, Islamic Rep.IrelandIsraelItalyJamaicaJapanJordanKazakhstanKenyaKorea, Rep.KosovoKuwaitKyrgyz RepublicLao PDRLate-demographic dividendLatin America & Caribbean Latin America & Caribbean (excluding high income)Latin America & the Caribbean (IDA & IBRD countries)LatviaLeast developed countries: UN classificationLebanonLiberiaLithuaniaLow & middle incomeLow incomeLower middle incomeLuxembourgMacao SAR, ChinaMacedonia, FYRMadagascarMalawiMalaysiaMaliMaltaMauritaniaMauritiusMexicoMiddle East & North AfricaMiddle East & North Africa (excluding high income)Middle East & North Africa (IDA & IBRD countries)Middle incomeMoldovaMongoliaMontenegroMoroccoMozambiqueNamibiaNepalNetherlandsNew ZealandNicaraguaNigerNigeriaNorth AmericaNorwayOECD membersOmanOther small statesPakistanPanamaPapua New GuineaParaguayPeruPhilippinesPolandPortugalPost-demographic dividendPre-demographic dividendPuerto RicoQatarRomaniaRussian FederationRwandaSaudi ArabiaSenegalSerbiaSeychellesSierra LeoneSingaporeSlovak RepublicSloveniaSmall statesSomaliaSouth AfricaSouth AsiaSouth Asia (IDA & IBRD)South SudanSpainSri LankaSub-Saharan Africa Sub-Saharan Africa (excluding high income)Sub-Saharan Africa (IDA & IBRD countries)SudanSurinameSwazilandSwedenSwitzerlandSyrian Arab RepublicTajikistanTanzaniaThailandTimor-LesteTogoTrinidad and TobagoTunisiaTurkeyTurkmenistanUgandaUkraineUnited Arab EmiratesUnited KingdomUnited StatesUpper middle incomeUruguayVanuatuVenezuela, RBVietnamWest Bank and GazaWorldZimbabwe Timeline:
This timeline shows a graph from 1972 to 2016 of United States. No data until 1971. Number of actual observations by date: 45.
Source name:
World Development Indicators
Source organization:
World Bank national accounts data, and OECD National Accounts data files.
Categories, topics:
Economy & Growth
Last updated:
apr 23, 2017
Indicators value changes by year
Minimum:
-1.601
jan 1, 2010
At the date of observation
Value
Absolute change
Change from previous value
jan 1, 1972
3.816
+3.816
0.0%
jan 1, 1973
6.133
+2.317
60.7%
jan 1, 1974
4.957
-1.176
-19.17%
jan 1, 1975
-0.825
-5.782
-116.64%
jan 1, 1976
2.27
+3.095
-375.15%
jan 1, 1977
5.577
+3.308
145.73%
jan 1, 1978
4.213
-1.364
-24.46%
jan 1, 1979
4.397
+0.184
4.37%
jan 1, 1980
2.375
-2.023
-46.0%
jan 1, 1981
-0.316
-2.69
-113.29%
jan 1, 1982
1.485
+1.801
-570.69%
jan 1, 1983
1.422
-0.064
-4.28%
jan 1, 1984
5.701
+4.279
300.98%
jan 1, 1985
5.273
-0.427
-7.5%
jan 1, 1986
5.258
-0.016
-0.3%
jan 1, 1987
4.2
-1.058
-20.12%
jan 1, 1988
3.383
-0.817
-19.46%
jan 1, 1989
4.183
+0.8
23.66%
jan 1, 1990
2.919
-1.264
-30.23%
jan 1, 1991
2.061
-0.857
-29.37%
jan 1, 1992
0.228
-1.833
-88.92%
jan 1, 1993
3.71
+3.481
1.52K%
jan 1, 1994
3.474
-0.236
-6.36%
jan 1, 1995
3.879
+0.405
11.65%
jan 1, 1996
2.991
-0.888
-22.89%
jan 1, 1997
3.493
+0.502
16.8%
jan 1, 1998
3.764
+0.271
7.75%
jan 1, 1999
5.347
+1.583
42.07%
jan 1, 2000
5.297
-0.05
-0.94%
jan 1, 2001
5.077
-0.22
-4.16%
jan 1, 2002
2.594
-2.483
-48.9%
jan 1, 2003
2.578
-0.016
-0.6%
jan 1, 2004
3.126
+0.547
21.23%
jan 1, 2005
3.841
+0.715
22.89%
jan 1, 2006
3.515
-0.327
-8.5%
jan 1, 2007
3.041
-0.473
-13.47%
jan 1, 2008
2.239
-0.803
-26.39%
jan 1, 2009
-0.342
-2.581
-115.29%
jan 1, 2010
-1.601
-1.259
367.71%
jan 1, 2011
1.923
+3.524
-220.11%
jan 1, 2012
2.263
+0.34
17.69%
jan 1, 2013
1.459
-0.804
-35.51%
jan 1, 2014
1.461
+0.002
0.11%
jan 1, 2015
2.872
+1.411
96.57%
jan 1, 2016
3.182
+0.31
10.8%
Ranking of countries by current statistics by years


Comments: