29
/
en
AIzaSyAYiBZKx7MnpbEhh9jyipgxe19OcubqV5w
April 1, 2024
78339
Bangladesh
BGD
true
2
1
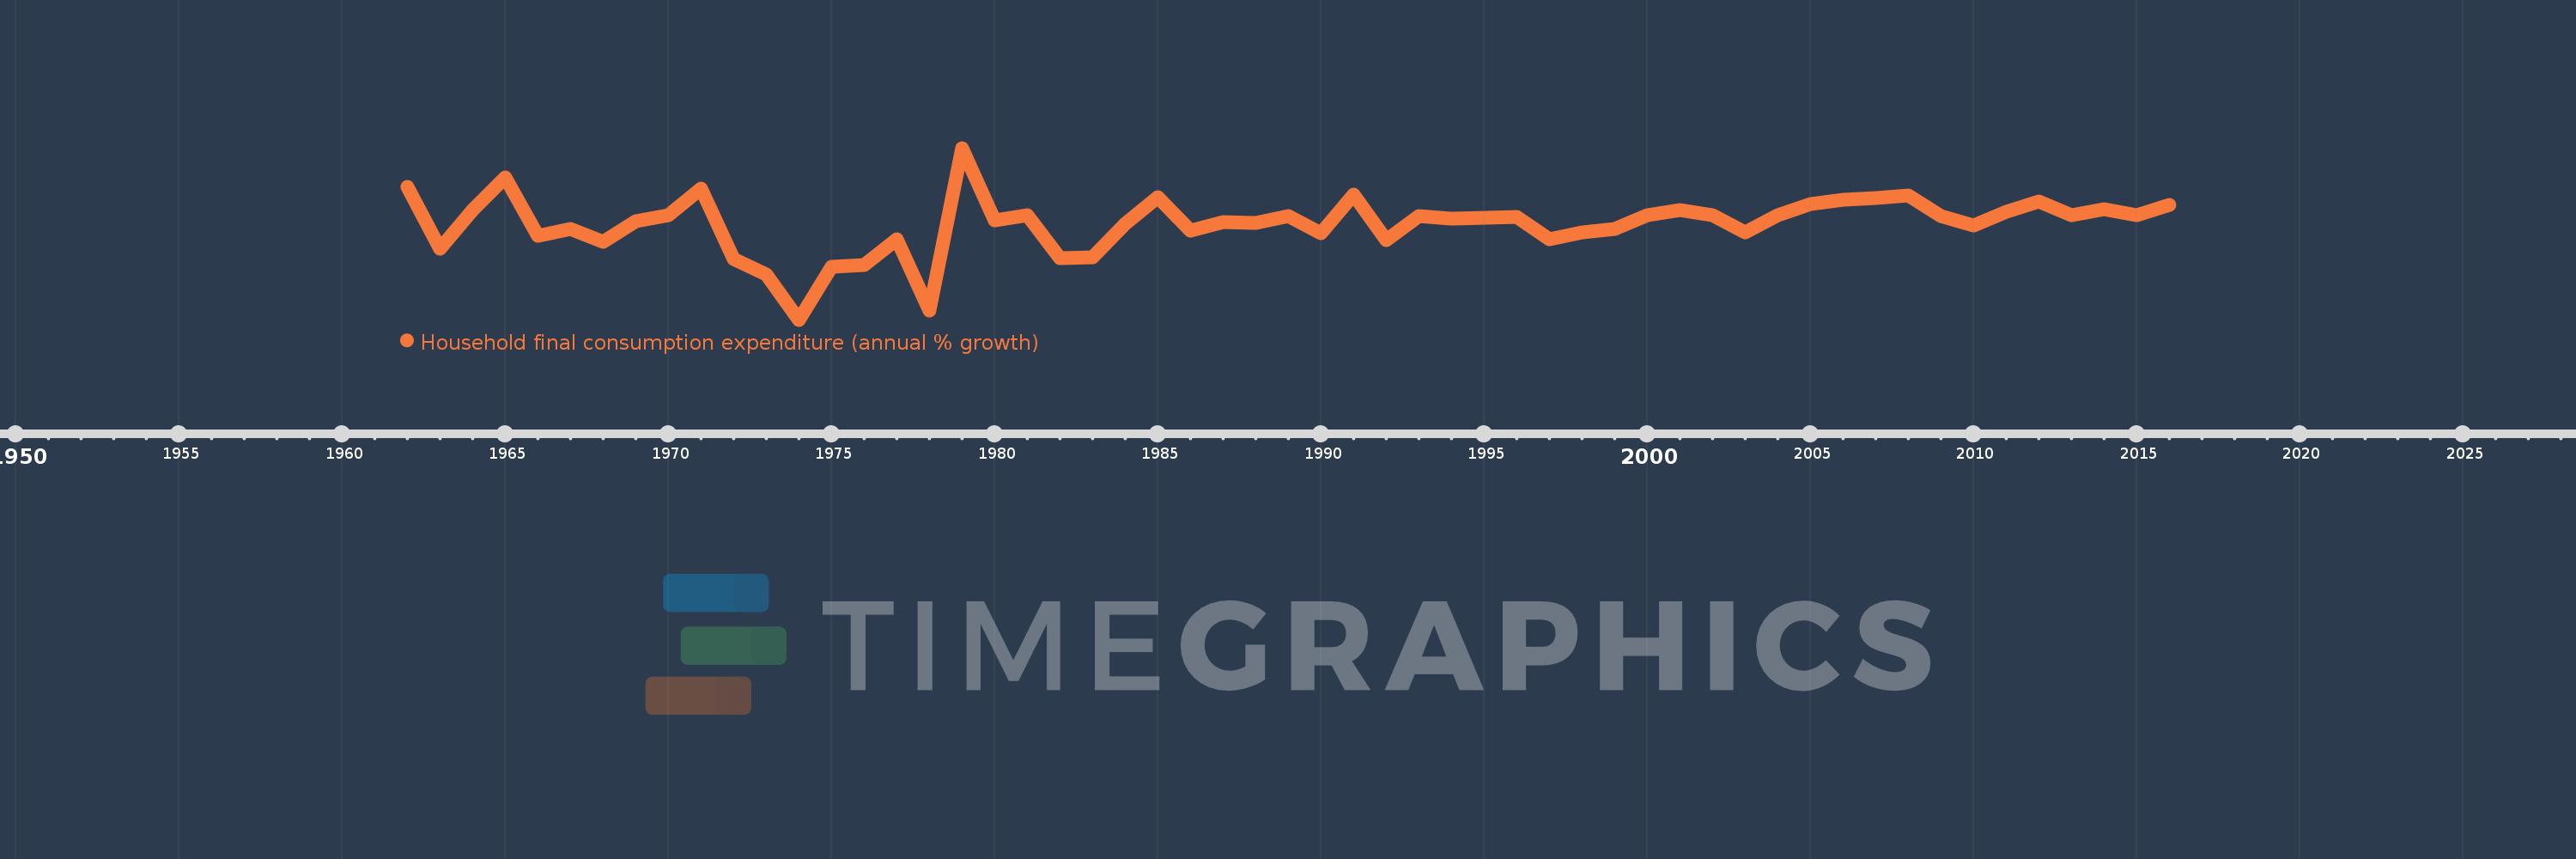
Household final consumption expenditure (annual % growth)
2016,2015,2014,2013,2012,2011,2010,2009,2008,2007,2006,2005,2004,2003,2002,2001,2000,1999,1998,1997,1996,1995,1994,1993,1992,1991,1990,1989,1988,1987,1986,1985,1984,1983,1982,1981,1980,1979,1978,1977,1976,1975,1974,1973,1972,1971,1970,1969,1968,1967,1966,1965,1964,1963,1962
This statistics in other country:
AlbaniaAlgeriaAntigua and BarbudaArab WorldArgentinaArmeniaAustraliaAustriaAzerbaijanBahamas, TheBahrainBangladeshBarbadosBelarusBelgiumBelizeBeninBhutanBoliviaBosnia and HerzegovinaBotswanaBrazilBrunei DarussalamBulgariaBurkina FasoBurundiCabo VerdeCambodiaCameroonCanadaCaribbean small statesCentral Europe and the BalticsChadChileChinaColombiaComorosCongo, Dem. Rep.Congo, Rep.Costa RicaCote d'IvoireCroatiaCubaCyprusCzech RepublicDenmarkDominican RepublicEarly-demographic dividendEast Asia & PacificEast Asia & Pacific (excluding high income)East Asia & Pacific (IDA & IBRD countries)EcuadorEgypt, Arab Rep.El SalvadorEquatorial GuineaEritreaEstoniaEthiopiaEuro areaEurope & Central AsiaEurope & Central Asia (excluding high income)Europe & Central Asia (IDA & IBRD countries)European UnionFinlandFranceGabonGambia, TheGeorgiaGermanyGhanaGreeceGuatemalaGuineaGuinea-BissauHaitiHeavily indebted poor countries (HIPC)High incomeHondurasHong Kong SAR, ChinaHungaryIBRD onlyIcelandIDA & IBRD totalIDA blendIDA onlyIDA totalIndiaIndonesiaIran, Islamic Rep.IrelandIsraelItalyJamaicaJapanJordanKazakhstanKenyaKorea, Rep.KosovoKuwaitKyrgyz RepublicLao PDRLate-demographic dividendLatin America & Caribbean Latin America & Caribbean (excluding high income)Latin America & the Caribbean (IDA & IBRD countries)LatviaLeast developed countries: UN classificationLebanonLiberiaLithuaniaLow & middle incomeLow incomeLower middle incomeLuxembourgMacao SAR, ChinaMacedonia, FYRMadagascarMalawiMalaysiaMaliMaltaMauritaniaMauritiusMexicoMiddle East & North AfricaMiddle East & North Africa (excluding high income)Middle East & North Africa (IDA & IBRD countries)Middle incomeMoldovaMongoliaMontenegroMoroccoMozambiqueNamibiaNepalNetherlandsNew ZealandNicaraguaNigerNigeriaNorth AmericaNorwayOECD membersOmanOther small statesPakistanPanamaPapua New GuineaParaguayPeruPhilippinesPolandPortugalPost-demographic dividendPre-demographic dividendPuerto RicoQatarRomaniaRussian FederationRwandaSaudi ArabiaSenegalSerbiaSeychellesSierra LeoneSingaporeSlovak RepublicSloveniaSmall statesSomaliaSouth AfricaSouth AsiaSouth Asia (IDA & IBRD)South SudanSpainSri LankaSub-Saharan Africa Sub-Saharan Africa (excluding high income)Sub-Saharan Africa (IDA & IBRD countries)SudanSurinameSwazilandSwedenSwitzerlandSyrian Arab RepublicTajikistanTanzaniaThailandTimor-LesteTogoTrinidad and TobagoTunisiaTurkeyTurkmenistanUgandaUkraineUnited Arab EmiratesUnited KingdomUnited StatesUpper middle incomeUruguayVanuatuVenezuela, RBVietnamWest Bank and GazaWorldZimbabwe Timeline:
This timeline shows a graph from 1962 to 2016 of Bangladesh. No data until 1961. Number of actual observations by date: 55.
Source name:
World Development Indicators
Source organization:
World Bank national accounts data, and OECD National Accounts data files.
Categories, topics:
Economy & Growth
Last updated:
apr 23, 2017
Indicators value changes by year
Minimum:
-14.02
jan 1, 1974
Maximum:
15.695
jan 1, 1979
At the date of observation
Value
Absolute change
Change from previous value
jan 1, 1962
8.949
+8.949
0.0%
jan 1, 1963
-1.744
-10.693
-119.49%
jan 1, 1964
4.911
+6.655
-381.61%
jan 1, 1965
10.594
+5.682
115.7%
jan 1, 1966
0.482
-10.112
-95.45%
jan 1, 1967
1.696
+1.215
252.18%
jan 1, 1968
-0.476
-2.173
-128.09%
jan 1, 1969
3.062
+3.538
-742.61%
jan 1, 1970
4.043
+0.982
32.06%
jan 1, 1971
8.741
+4.698
116.18%
jan 1, 1972
-3.519
-12.26
-140.26%
jan 1, 1973
-6.172
-2.653
75.39%
jan 1, 1974
-14.02
-7.847
127.13%
jan 1, 1975
-4.836
+9.184
-65.51%
jan 1, 1976
-4.608
+0.228
-4.72%
jan 1, 1977
-0.16
+4.448
-96.53%
jan 1, 1978
-12.501
-12.341
7.72K%
jan 1, 1979
15.695
+28.196
-225.55%
jan 1, 1980
3.122
-12.573
-80.11%
jan 1, 1981
4.056
+0.934
29.92%
jan 1, 1982
-3.396
-7.452
-183.73%
jan 1, 1983
-3.17
+0.226
-6.66%
jan 1, 1984
2.621
+5.79
-182.67%
jan 1, 1985
7.202
+4.581
174.83%
jan 1, 1986
1.32
-5.882
-81.67%
jan 1, 1987
2.858
+1.538
116.5%
jan 1, 1988
2.737
-0.121
-4.22%
jan 1, 1989
3.88
+1.143
41.76%
jan 1, 1990
0.903
-2.977
-76.73%
jan 1, 1991
7.639
+6.736
745.93%
jan 1, 1992
-0.317
-7.956
-104.15%
jan 1, 1993
3.946
+4.263
-1.35K%
jan 1, 1994
3.405
-0.541
-13.7%
jan 1, 1995
3.662
+0.257
7.56%
jan 1, 1996
3.746
+0.084
2.29%
jan 1, 1997
-0.096
-3.843
-102.57%
jan 1, 1998
1.05
+1.147
-1.19K%
jan 1, 1999
1.689
+0.639
60.85%
jan 1, 2000
3.991
+2.302
136.25%
jan 1, 2001
4.975
+0.984
24.66%
jan 1, 2002
4.133
-0.842
-16.93%
jan 1, 2003
1.057
-3.075
-74.42%
jan 1, 2004
4.052
+2.995
283.25%
jan 1, 2005
5.969
+1.918
47.33%
jan 1, 2006
6.732
+0.762
12.77%
jan 1, 2007
7.048
+0.316
4.69%
jan 1, 2008
7.434
+0.386
5.48%
jan 1, 2009
3.98
-3.454
-46.46%
jan 1, 2010
2.292
-1.689
-42.42%
jan 1, 2011
4.604
+2.312
100.9%
jan 1, 2012
6.492
+1.888
41.0%
jan 1, 2013
4.114
-2.377
-36.62%
jan 1, 2014
5.127
+1.013
24.63%
jan 1, 2015
4.006
-1.122
-21.88%
jan 1, 2016
5.817
+1.812
45.23%
Ranking of countries by current statistics by years


Comments: