29
/
en
AIzaSyAYiBZKx7MnpbEhh9jyipgxe19OcubqV5w
April 1, 2024
58988
Sub-Saharan Africa
SSF
false
2
1
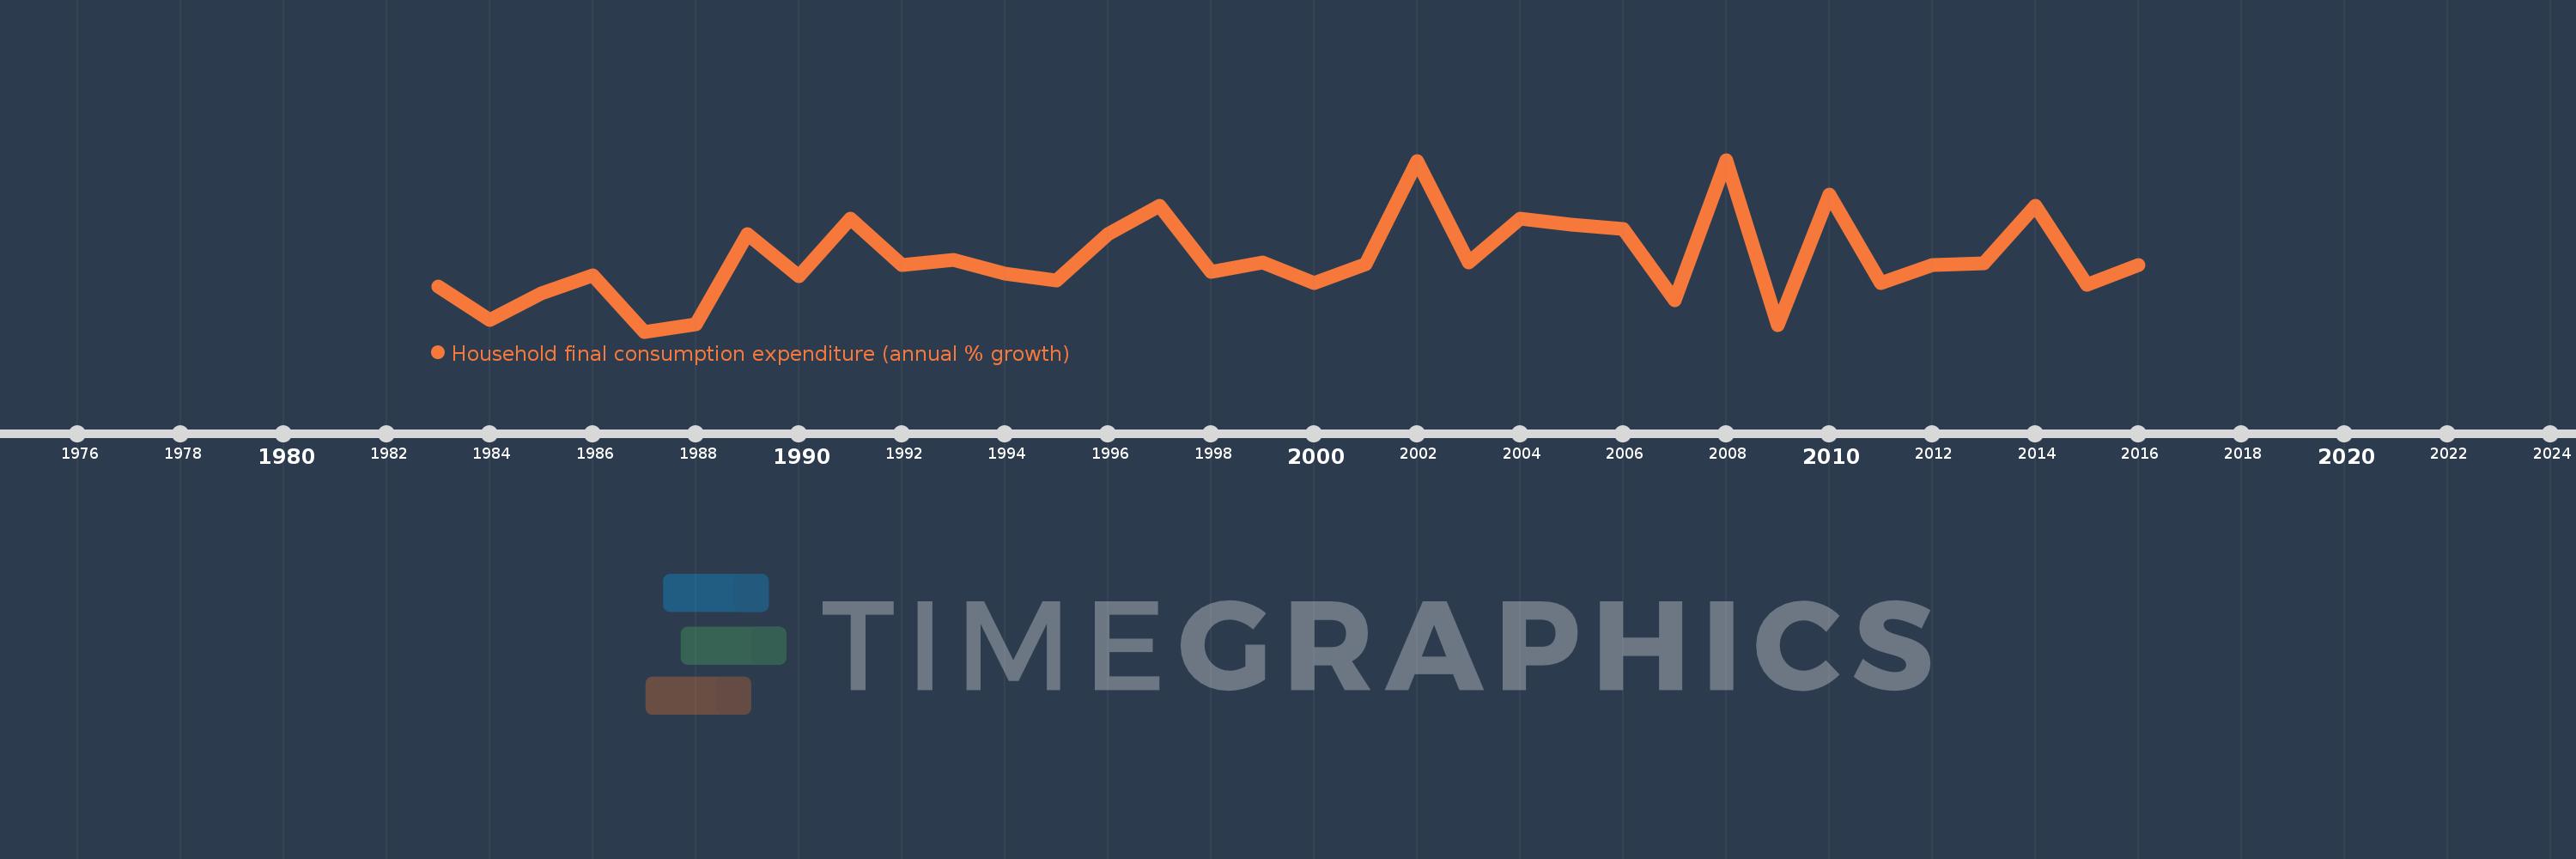
Household final consumption expenditure (annual % growth)
2016,2015,2014,2013,2012,2011,2010,2009,2008,2007,2006,2005,2004,2003,2002,2001,2000,1999,1998,1997,1996,1995,1994,1993,1992,1991,1990,1989,1988,1987,1986,1985,1984,1983
This statistics in other country:
AlbaniaAlgeriaAntigua and BarbudaArab WorldArgentinaArmeniaAustraliaAustriaAzerbaijanBahamas, TheBahrainBangladeshBarbadosBelarusBelgiumBelizeBeninBhutanBoliviaBosnia and HerzegovinaBotswanaBrazilBrunei DarussalamBulgariaBurkina FasoBurundiCabo VerdeCambodiaCameroonCanadaCaribbean small statesCentral Europe and the BalticsChadChileChinaColombiaComorosCongo, Dem. Rep.Congo, Rep.Costa RicaCote d'IvoireCroatiaCubaCyprusCzech RepublicDenmarkDominican RepublicEarly-demographic dividendEast Asia & PacificEast Asia & Pacific (excluding high income)East Asia & Pacific (IDA & IBRD countries)EcuadorEgypt, Arab Rep.El SalvadorEquatorial GuineaEritreaEstoniaEthiopiaEuro areaEurope & Central AsiaEurope & Central Asia (excluding high income)Europe & Central Asia (IDA & IBRD countries)European UnionFinlandFranceGabonGambia, TheGeorgiaGermanyGhanaGreeceGuatemalaGuineaGuinea-BissauHaitiHeavily indebted poor countries (HIPC)High incomeHondurasHong Kong SAR, ChinaHungaryIBRD onlyIcelandIDA & IBRD totalIDA blendIDA onlyIDA totalIndiaIndonesiaIran, Islamic Rep.IrelandIsraelItalyJamaicaJapanJordanKazakhstanKenyaKorea, Rep.KosovoKuwaitKyrgyz RepublicLao PDRLate-demographic dividendLatin America & Caribbean Latin America & Caribbean (excluding high income)Latin America & the Caribbean (IDA & IBRD countries)LatviaLeast developed countries: UN classificationLebanonLiberiaLithuaniaLow & middle incomeLow incomeLower middle incomeLuxembourgMacao SAR, ChinaMacedonia, FYRMadagascarMalawiMalaysiaMaliMaltaMauritaniaMauritiusMexicoMiddle East & North AfricaMiddle East & North Africa (excluding high income)Middle East & North Africa (IDA & IBRD countries)Middle incomeMoldovaMongoliaMontenegroMoroccoMozambiqueNamibiaNepalNetherlandsNew ZealandNicaraguaNigerNigeriaNorth AmericaNorwayOECD membersOmanOther small statesPakistanPanamaPapua New GuineaParaguayPeruPhilippinesPolandPortugalPost-demographic dividendPre-demographic dividendPuerto RicoQatarRomaniaRussian FederationRwandaSaudi ArabiaSenegalSerbiaSeychellesSierra LeoneSingaporeSlovak RepublicSloveniaSmall statesSomaliaSouth AfricaSouth AsiaSouth Asia (IDA & IBRD)South SudanSpainSri LankaSub-Saharan Africa Sub-Saharan Africa (excluding high income)Sub-Saharan Africa (IDA & IBRD countries)SudanSurinameSwazilandSwedenSwitzerlandSyrian Arab RepublicTajikistanTanzaniaThailandTimor-LesteTogoTrinidad and TobagoTunisiaTurkeyTurkmenistanUgandaUkraineUnited Arab EmiratesUnited KingdomUnited StatesUpper middle incomeUruguayVanuatuVenezuela, RBVietnamWest Bank and GazaWorldZimbabwe Timeline:
This timeline shows a graph from 1983 to 2016 of Sub-Saharan Africa . No data until 1982. Number of actual observations by date: 34.
Source name:
World Development Indicators
Source organization:
World Bank national accounts data, and OECD National Accounts data files.
Categories, topics:
Economy & Growth
Last updated:
apr 23, 2017
Indicators value changes by year
Minimum:
-5.633
jan 1, 1987
Maximum:
14.506
jan 1, 2008
At the date of observation
Value
Absolute change
Change from previous value
jan 1, 1983
-0.359
-0.359
0.0%
jan 1, 1984
-4.309
-3.95
1.1K%
jan 1, 1985
-1.115
+3.194
-74.13%
jan 1, 1986
0.968
+2.082
-186.79%
jan 1, 1987
-5.633
-6.601
-682.24%
jan 1, 1988
-4.746
+0.888
-15.76%
jan 1, 1989
5.829
+10.574
-222.82%
jan 1, 1990
0.83
-4.998
-85.76%
jan 1, 1991
7.583
+6.753
813.56%
jan 1, 1992
2.127
-5.456
-71.95%
jan 1, 1993
2.753
+0.626
29.4%
jan 1, 1994
1.118
-1.635
-59.4%
jan 1, 1995
0.368
-0.749
-67.04%
jan 1, 1996
5.796
+5.428
1.47K%
jan 1, 1997
9.148
+3.352
57.83%
jan 1, 1998
1.322
-7.826
-85.55%
jan 1, 1999
2.465
+1.143
86.46%
jan 1, 2000
0.085
-2.38
-96.57%
jan 1, 2001
2.226
+2.142
2.53K%
jan 1, 2002
14.392
+12.165
546.45%
jan 1, 2003
2.43
-11.962
-83.12%
jan 1, 2004
7.567
+5.138
211.45%
jan 1, 2005
6.924
-0.643
-8.49%
jan 1, 2006
6.414
-0.51
-7.37%
jan 1, 2007
-1.953
-8.367
-130.45%
jan 1, 2008
14.506
+16.459
-842.69%
jan 1, 2009
-4.869
-19.375
-133.57%
jan 1, 2010
10.433
+15.302
-314.28%
jan 1, 2011
0.042
-10.392
-99.6%
jan 1, 2012
2.169
+2.127
5.11K%
jan 1, 2013
2.408
+0.239
11.02%
jan 1, 2014
9.157
+6.75
280.34%
jan 1, 2015
-0.107
-9.265
-101.17%
jan 1, 2016
2.147
+2.254
-2.1K%
Ranking of countries by current statistics by years


Comments: