29
/
en
AIzaSyAYiBZKx7MnpbEhh9jyipgxe19OcubqV5w
April 1, 2024
42451
Latin America & Caribbean (excluding high income)
LAC
false
2
1
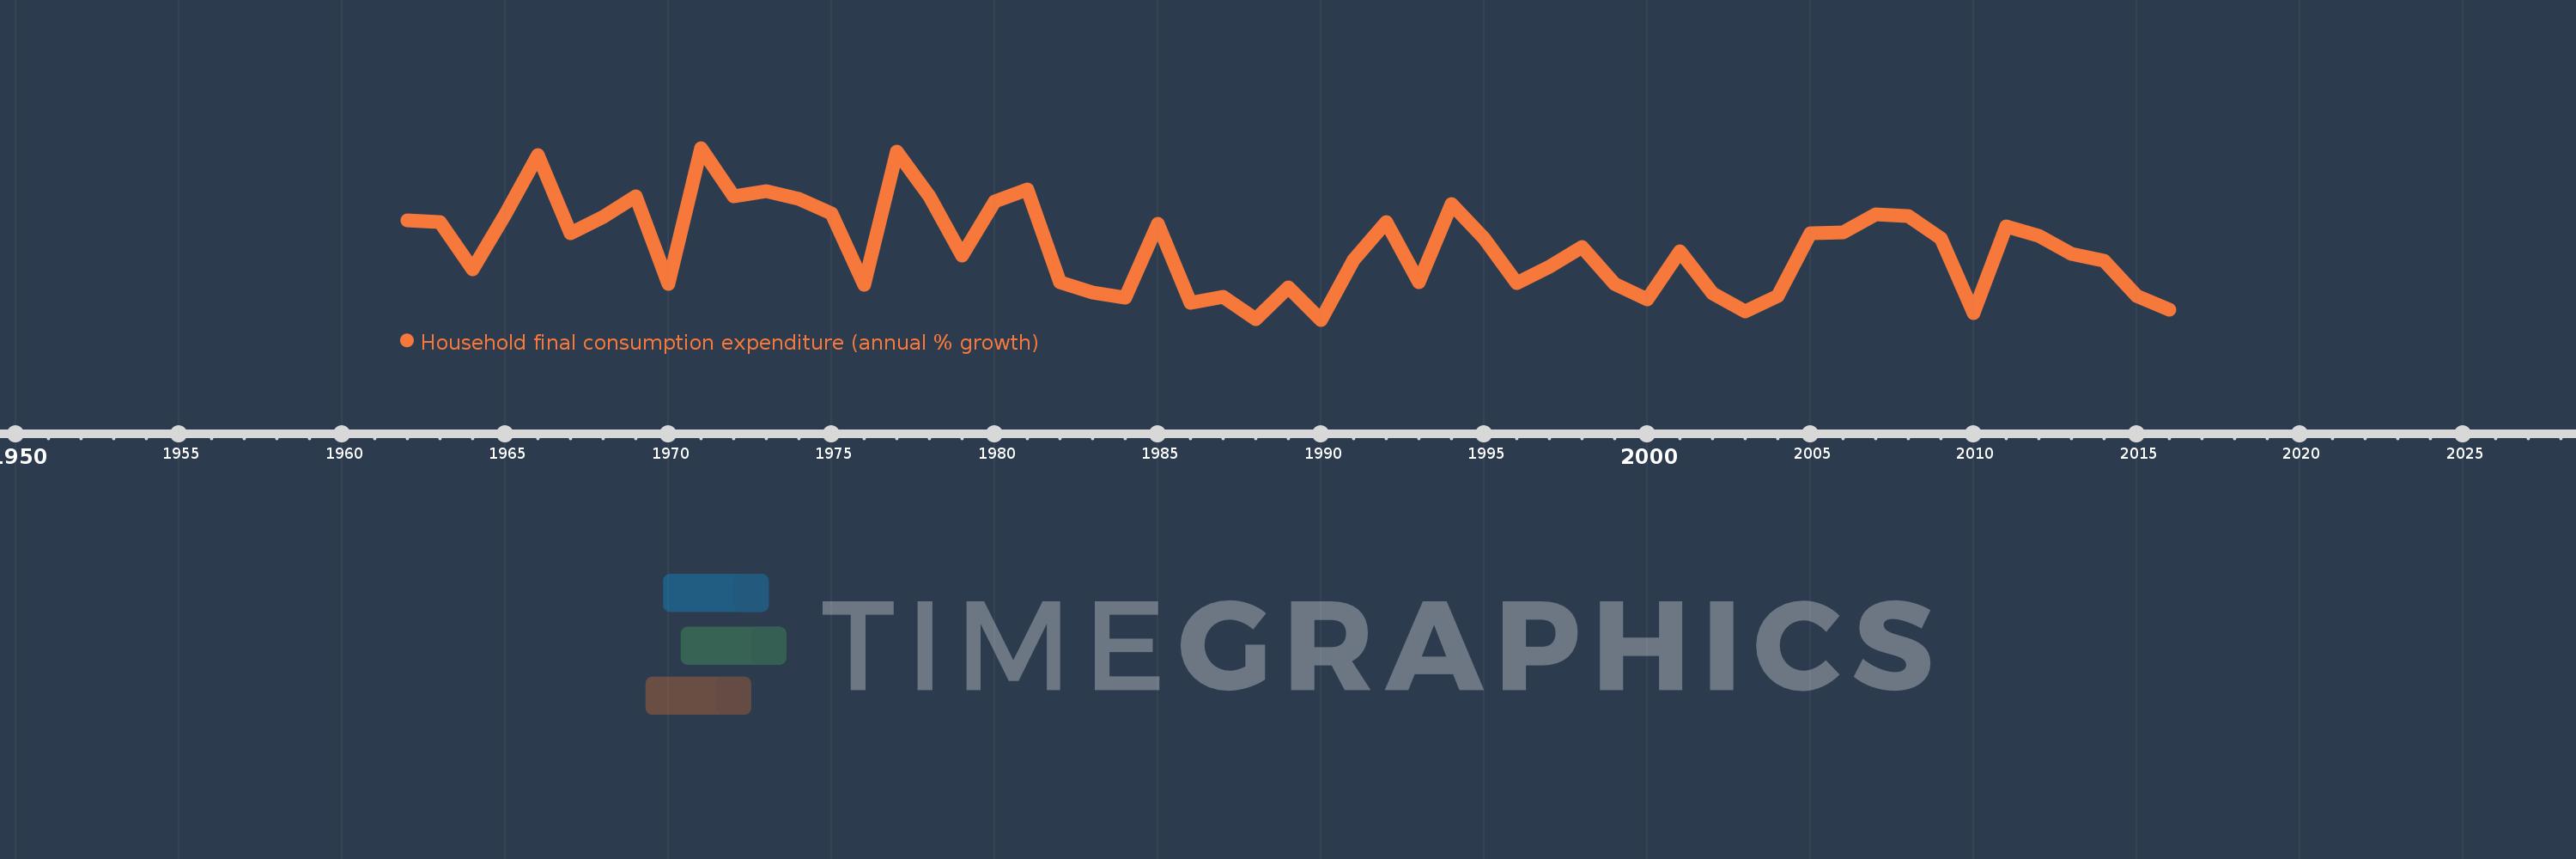
Household final consumption expenditure (annual % growth)
2016,2015,2014,2013,2012,2011,2010,2009,2008,2007,2006,2005,2004,2003,2002,2001,2000,1999,1998,1997,1996,1995,1994,1993,1992,1991,1990,1989,1988,1987,1986,1985,1984,1983,1982,1981,1980,1979,1978,1977,1976,1975,1974,1973,1972,1971,1970,1969,1968,1967,1966,1965,1964,1963,1962
This statistics in other country:
AlbaniaAlgeriaAntigua and BarbudaArab WorldArgentinaArmeniaAustraliaAustriaAzerbaijanBahamas, TheBahrainBangladeshBarbadosBelarusBelgiumBelizeBeninBhutanBoliviaBosnia and HerzegovinaBotswanaBrazilBrunei DarussalamBulgariaBurkina FasoBurundiCabo VerdeCambodiaCameroonCanadaCaribbean small statesCentral Europe and the BalticsChadChileChinaColombiaComorosCongo, Dem. Rep.Congo, Rep.Costa RicaCote d'IvoireCroatiaCubaCyprusCzech RepublicDenmarkDominican RepublicEarly-demographic dividendEast Asia & PacificEast Asia & Pacific (excluding high income)East Asia & Pacific (IDA & IBRD countries)EcuadorEgypt, Arab Rep.El SalvadorEquatorial GuineaEritreaEstoniaEthiopiaEuro areaEurope & Central AsiaEurope & Central Asia (excluding high income)Europe & Central Asia (IDA & IBRD countries)European UnionFinlandFranceGabonGambia, TheGeorgiaGermanyGhanaGreeceGuatemalaGuineaGuinea-BissauHaitiHeavily indebted poor countries (HIPC)High incomeHondurasHong Kong SAR, ChinaHungaryIBRD onlyIcelandIDA & IBRD totalIDA blendIDA onlyIDA totalIndiaIndonesiaIran, Islamic Rep.IrelandIsraelItalyJamaicaJapanJordanKazakhstanKenyaKorea, Rep.KosovoKuwaitKyrgyz RepublicLao PDRLate-demographic dividendLatin America & Caribbean Latin America & Caribbean (excluding high income)Latin America & the Caribbean (IDA & IBRD countries)LatviaLeast developed countries: UN classificationLebanonLiberiaLithuaniaLow & middle incomeLow incomeLower middle incomeLuxembourgMacao SAR, ChinaMacedonia, FYRMadagascarMalawiMalaysiaMaliMaltaMauritaniaMauritiusMexicoMiddle East & North AfricaMiddle East & North Africa (excluding high income)Middle East & North Africa (IDA & IBRD countries)Middle incomeMoldovaMongoliaMontenegroMoroccoMozambiqueNamibiaNepalNetherlandsNew ZealandNicaraguaNigerNigeriaNorth AmericaNorwayOECD membersOmanOther small statesPakistanPanamaPapua New GuineaParaguayPeruPhilippinesPolandPortugalPost-demographic dividendPre-demographic dividendPuerto RicoQatarRomaniaRussian FederationRwandaSaudi ArabiaSenegalSerbiaSeychellesSierra LeoneSingaporeSlovak RepublicSloveniaSmall statesSomaliaSouth AfricaSouth AsiaSouth Asia (IDA & IBRD)South SudanSpainSri LankaSub-Saharan Africa Sub-Saharan Africa (excluding high income)Sub-Saharan Africa (IDA & IBRD countries)SudanSurinameSwazilandSwedenSwitzerlandSyrian Arab RepublicTajikistanTanzaniaThailandTimor-LesteTogoTrinidad and TobagoTunisiaTurkeyTurkmenistanUgandaUkraineUnited Arab EmiratesUnited KingdomUnited StatesUpper middle incomeUruguayVanuatuVenezuela, RBVietnamWest Bank and GazaWorldZimbabwe Timeline:
This timeline shows a graph from 1962 to 2016 of Latin America & Caribbean (excluding high income). No data until 1961. Number of actual observations by date: 55.
Source name:
World Development Indicators
Source organization:
World Bank national accounts data, and OECD National Accounts data files.
Categories, topics:
Economy & Growth
Last updated:
apr 23, 2017
Indicators value changes by year
Minimum:
-0.742
jan 1, 1990
Maximum:
11.335
jan 1, 1971
At the date of observation
Value
Absolute change
Change from previous value
jan 1, 1962
6.24
+6.24
0.0%
jan 1, 1963
6.138
-0.102
-1.64%
jan 1, 1964
2.818
-3.32
-54.09%
jan 1, 1965
6.648
+3.829
135.89%
jan 1, 1966
10.834
+4.186
62.97%
jan 1, 1967
5.333
-5.501
-50.78%
jan 1, 1968
6.509
+1.177
22.06%
jan 1, 1969
7.961
+1.452
22.31%
jan 1, 1970
1.763
-6.198
-77.85%
jan 1, 1971
11.335
+9.572
542.87%
jan 1, 1972
7.952
-3.383
-29.85%
jan 1, 1973
8.319
+0.367
4.61%
jan 1, 1974
7.75
-0.569
-6.84%
jan 1, 1975
6.729
-1.021
-13.17%
jan 1, 1976
1.718
-5.011
-74.47%
jan 1, 1977
11.056
+9.338
543.58%
jan 1, 1978
7.932
-3.124
-28.26%
jan 1, 1979
3.789
-4.143
-52.23%
jan 1, 1980
7.545
+3.756
99.13%
jan 1, 1981
8.436
+0.891
11.81%
jan 1, 1982
1.892
-6.544
-77.57%
jan 1, 1983
1.196
-0.696
-36.78%
jan 1, 1984
0.838
-0.358
-29.93%
jan 1, 1985
5.975
+5.137
612.8%
jan 1, 1986
0.456
-5.519
-92.37%
jan 1, 1987
0.891
+0.435
95.41%
jan 1, 1988
-0.672
-1.562
-175.37%
jan 1, 1989
1.518
+2.189
-326.02%
jan 1, 1990
-0.742
-2.26
-148.9%
jan 1, 1991
3.444
+4.186
-564.07%
jan 1, 1992
6.117
+2.673
77.63%
jan 1, 1993
1.881
-4.237
-69.26%
jan 1, 1994
7.413
+5.532
294.17%
jan 1, 1995
4.996
-2.416
-32.6%
jan 1, 1996
1.818
-3.178
-63.6%
jan 1, 1997
2.962
+1.143
62.87%
jan 1, 1998
4.37
+1.409
47.57%
jan 1, 1999
1.796
-2.575
-58.92%
jan 1, 2000
0.683
-1.113
-61.96%
jan 1, 2001
4.067
+3.384
495.45%
jan 1, 2002
1.13
-2.937
-72.22%
jan 1, 2003
-0.173
-1.303
-115.35%
jan 1, 2004
0.923
+1.096
-632.29%
jan 1, 2005
5.365
+4.442
481.42%
jan 1, 2006
5.425
+0.06
1.11%
jan 1, 2007
6.667
+1.242
22.9%
jan 1, 2008
6.526
-0.142
-2.12%
jan 1, 2009
4.994
-1.531
-23.47%
jan 1, 2010
-0.272
-5.266
-105.45%
jan 1, 2011
5.834
+6.106
-2.24K%
jan 1, 2012
5.129
-0.705
-12.08%
jan 1, 2013
3.865
-1.264
-24.65%
jan 1, 2014
3.406
-0.458
-11.86%
jan 1, 2015
0.906
-2.5
-73.39%
jan 1, 2016
-0.007
-0.913
-100.77%
Ranking of countries by current statistics by years


Comments: