29
/
en
AIzaSyAYiBZKx7MnpbEhh9jyipgxe19OcubqV5w
April 1, 2024
87323
Bolivia
BOL
true
2
1
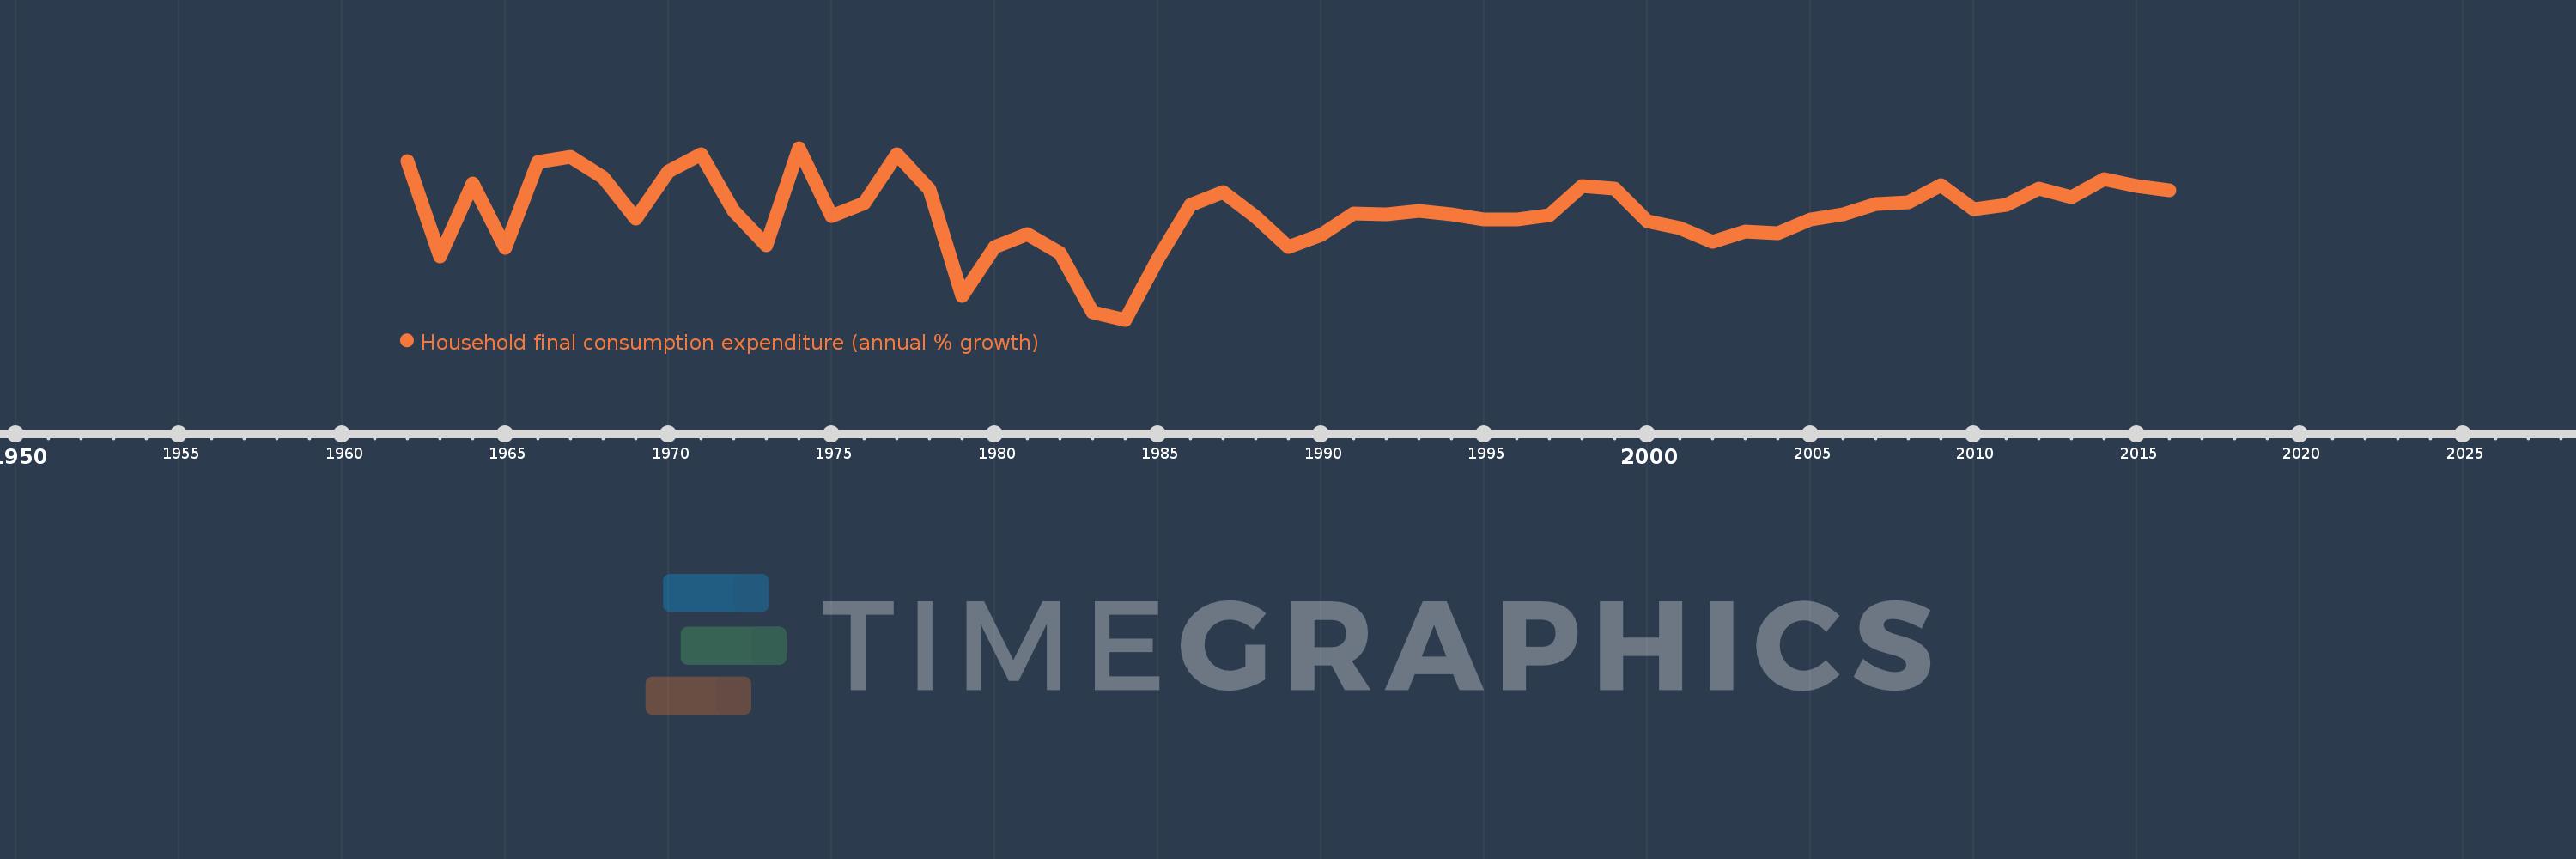
Household final consumption expenditure (annual % growth)
2016,2015,2014,2013,2012,2011,2010,2009,2008,2007,2006,2005,2004,2003,2002,2001,2000,1999,1998,1997,1996,1995,1994,1993,1992,1991,1990,1989,1988,1987,1986,1985,1984,1983,1982,1981,1980,1979,1978,1977,1976,1975,1974,1973,1972,1971,1970,1969,1968,1967,1966,1965,1964,1963,1962
This statistics in other country:
AlbaniaAlgeriaAntigua and BarbudaArab WorldArgentinaArmeniaAustraliaAustriaAzerbaijanBahamas, TheBahrainBangladeshBarbadosBelarusBelgiumBelizeBeninBhutanBoliviaBosnia and HerzegovinaBotswanaBrazilBrunei DarussalamBulgariaBurkina FasoBurundiCabo VerdeCambodiaCameroonCanadaCaribbean small statesCentral Europe and the BalticsChadChileChinaColombiaComorosCongo, Dem. Rep.Congo, Rep.Costa RicaCote d'IvoireCroatiaCubaCyprusCzech RepublicDenmarkDominican RepublicEarly-demographic dividendEast Asia & PacificEast Asia & Pacific (excluding high income)East Asia & Pacific (IDA & IBRD countries)EcuadorEgypt, Arab Rep.El SalvadorEquatorial GuineaEritreaEstoniaEthiopiaEuro areaEurope & Central AsiaEurope & Central Asia (excluding high income)Europe & Central Asia (IDA & IBRD countries)European UnionFinlandFranceGabonGambia, TheGeorgiaGermanyGhanaGreeceGuatemalaGuineaGuinea-BissauHaitiHeavily indebted poor countries (HIPC)High incomeHondurasHong Kong SAR, ChinaHungaryIBRD onlyIcelandIDA & IBRD totalIDA blendIDA onlyIDA totalIndiaIndonesiaIran, Islamic Rep.IrelandIsraelItalyJamaicaJapanJordanKazakhstanKenyaKorea, Rep.KosovoKuwaitKyrgyz RepublicLao PDRLate-demographic dividendLatin America & Caribbean Latin America & Caribbean (excluding high income)Latin America & the Caribbean (IDA & IBRD countries)LatviaLeast developed countries: UN classificationLebanonLiberiaLithuaniaLow & middle incomeLow incomeLower middle incomeLuxembourgMacao SAR, ChinaMacedonia, FYRMadagascarMalawiMalaysiaMaliMaltaMauritaniaMauritiusMexicoMiddle East & North AfricaMiddle East & North Africa (excluding high income)Middle East & North Africa (IDA & IBRD countries)Middle incomeMoldovaMongoliaMontenegroMoroccoMozambiqueNamibiaNepalNetherlandsNew ZealandNicaraguaNigerNigeriaNorth AmericaNorwayOECD membersOmanOther small statesPakistanPanamaPapua New GuineaParaguayPeruPhilippinesPolandPortugalPost-demographic dividendPre-demographic dividendPuerto RicoQatarRomaniaRussian FederationRwandaSaudi ArabiaSenegalSerbiaSeychellesSierra LeoneSingaporeSlovak RepublicSloveniaSmall statesSomaliaSouth AfricaSouth AsiaSouth Asia (IDA & IBRD)South SudanSpainSri LankaSub-Saharan Africa Sub-Saharan Africa (excluding high income)Sub-Saharan Africa (IDA & IBRD countries)SudanSurinameSwazilandSwedenSwitzerlandSyrian Arab RepublicTajikistanTanzaniaThailandTimor-LesteTogoTrinidad and TobagoTunisiaTurkeyTurkmenistanUgandaUkraineUnited Arab EmiratesUnited KingdomUnited StatesUpper middle incomeUruguayVanuatuVenezuela, RBVietnamWest Bank and GazaWorldZimbabwe Timeline:
This timeline shows a graph from 1962 to 2016 of Bolivia. No data until 1961. Number of actual observations by date: 55.
Source name:
World Development Indicators
Source organization:
World Bank national accounts data, and OECD National Accounts data files.
Categories, topics:
Economy & Growth
Last updated:
apr 23, 2017
Indicators value changes by year
Minimum:
-4.584
jan 1, 1984
At the date of observation
Value
Absolute change
Change from previous value
jan 1, 1962
7.273
+7.273
0.0%
jan 1, 1963
0.16
-7.113
-97.8%
jan 1, 1964
5.617
+5.457
3.41K%
jan 1, 1965
0.823
-4.794
-85.34%
jan 1, 1966
7.219
+6.395
776.78%
jan 1, 1967
7.586
+0.367
5.08%
jan 1, 1968
6.06
-1.526
-20.12%
jan 1, 1969
2.95
-3.11
-51.31%
jan 1, 1970
6.522
+3.572
121.08%
jan 1, 1971
7.789
+1.266
19.42%
jan 1, 1972
3.569
-4.22
-54.18%
jan 1, 1973
0.991
-2.578
-72.24%
jan 1, 1974
8.271
+7.28
734.8%
jan 1, 1975
3.169
-5.102
-61.68%
jan 1, 1976
4.11
+0.941
29.7%
jan 1, 1977
7.819
+3.709
90.23%
jan 1, 1978
5.16
-2.659
-34.01%
jan 1, 1979
-2.805
-7.965
-154.36%
jan 1, 1980
0.855
+3.66
-130.5%
jan 1, 1981
1.849
+0.993
116.11%
jan 1, 1982
0.413
-1.436
-77.68%
jan 1, 1983
-4.006
-4.419
-1.07K%
jan 1, 1984
-4.584
-0.577
14.41%
jan 1, 1985
-0.02
+4.563
-99.55%
jan 1, 1986
3.978
+3.999
-19.59K%
jan 1, 1987
4.975
+0.997
25.06%
jan 1, 1988
3.109
-1.867
-37.52%
jan 1, 1989
0.89
-2.219
-71.37%
jan 1, 1990
1.785
+0.895
100.52%
jan 1, 1991
3.377
+1.592
89.2%
jan 1, 1992
3.323
-0.053
-1.58%
jan 1, 1993
3.556
+0.232
6.99%
jan 1, 1994
3.325
-0.231
-6.49%
jan 1, 1995
2.934
-0.391
-11.77%
jan 1, 1996
2.947
+0.013
0.46%
jan 1, 1997
3.266
+0.319
10.82%
jan 1, 1998
5.429
+2.163
66.23%
jan 1, 1999
5.253
-0.176
-3.24%
jan 1, 2000
2.762
-2.491
-47.42%
jan 1, 2001
2.303
-0.459
-16.63%
jan 1, 2002
1.269
-1.034
-44.89%
jan 1, 2003
2.045
+0.775
61.09%
jan 1, 2004
1.884
-0.161
-7.86%
jan 1, 2005
2.91
+1.026
54.47%
jan 1, 2006
3.329
+0.419
14.41%
jan 1, 2007
4.071
+0.742
22.28%
jan 1, 2008
4.171
+0.099
2.44%
jan 1, 2009
5.484
+1.313
31.48%
jan 1, 2010
3.669
-1.814
-33.09%
jan 1, 2011
3.98
+0.311
8.47%
jan 1, 2012
5.203
+1.223
30.73%
jan 1, 2013
4.605
-0.599
-11.5%
jan 1, 2014
5.927
+1.322
28.72%
jan 1, 2015
5.421
-0.506
-8.54%
jan 1, 2016
5.103
-0.317
-5.86%
Ranking of countries by current statistics by years


Comments: