29
/
en
AIzaSyAYiBZKx7MnpbEhh9jyipgxe19OcubqV5w
April 1, 2024
183010
Macao SAR, China
MAC
true
2
1
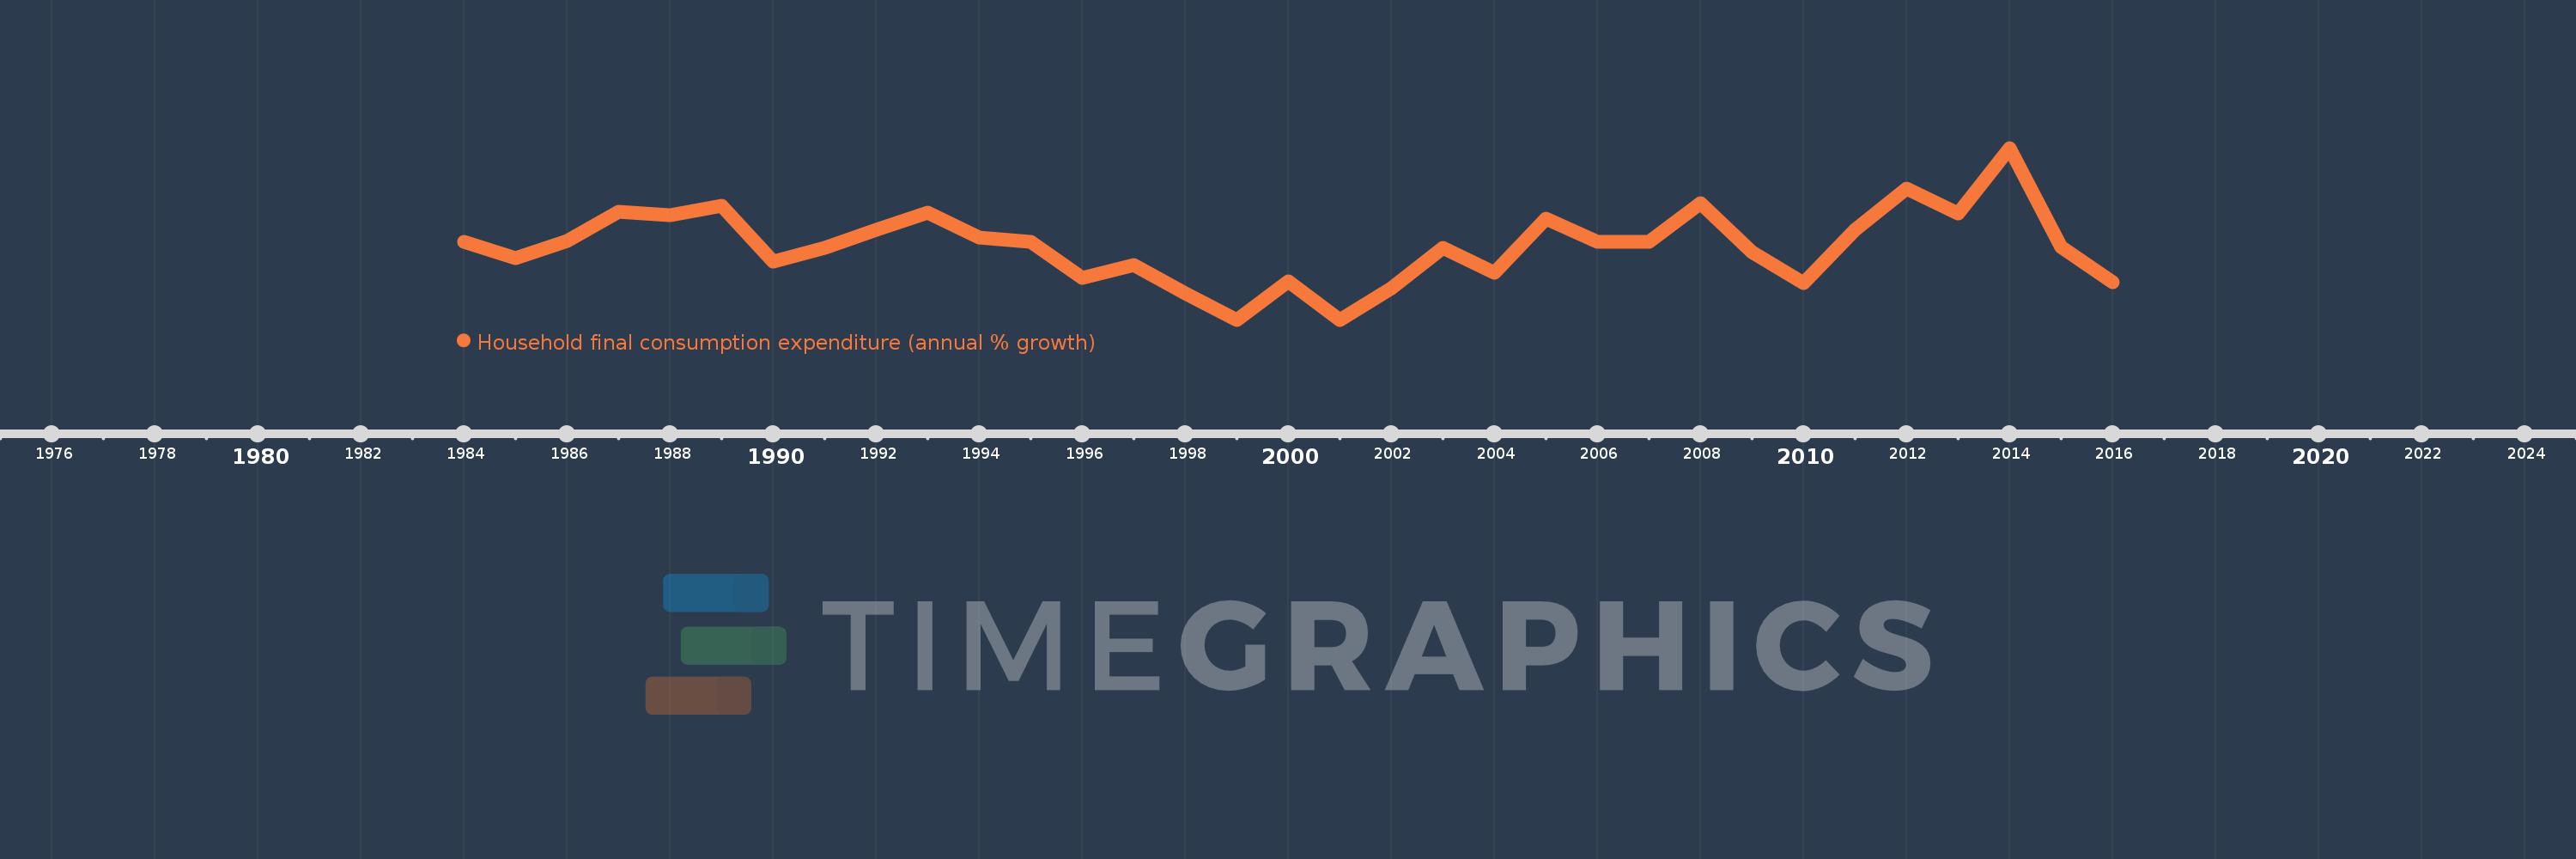
Household final consumption expenditure (annual % growth)
2016,2015,2014,2013,2012,2011,2010,2009,2008,2007,2006,2005,2004,2003,2002,2001,2000,1999,1998,1997,1996,1995,1994,1993,1992,1991,1990,1989,1988,1987,1986,1985,1984
This statistics in other country:
AlbaniaAlgeriaAntigua and BarbudaArab WorldArgentinaArmeniaAustraliaAustriaAzerbaijanBahamas, TheBahrainBangladeshBarbadosBelarusBelgiumBelizeBeninBhutanBoliviaBosnia and HerzegovinaBotswanaBrazilBrunei DarussalamBulgariaBurkina FasoBurundiCabo VerdeCambodiaCameroonCanadaCaribbean small statesCentral Europe and the BalticsChadChileChinaColombiaComorosCongo, Dem. Rep.Congo, Rep.Costa RicaCote d'IvoireCroatiaCubaCyprusCzech RepublicDenmarkDominican RepublicEarly-demographic dividendEast Asia & PacificEast Asia & Pacific (excluding high income)East Asia & Pacific (IDA & IBRD countries)EcuadorEgypt, Arab Rep.El SalvadorEquatorial GuineaEritreaEstoniaEthiopiaEuro areaEurope & Central AsiaEurope & Central Asia (excluding high income)Europe & Central Asia (IDA & IBRD countries)European UnionFinlandFranceGabonGambia, TheGeorgiaGermanyGhanaGreeceGuatemalaGuineaGuinea-BissauHaitiHeavily indebted poor countries (HIPC)High incomeHondurasHong Kong SAR, ChinaHungaryIBRD onlyIcelandIDA & IBRD totalIDA blendIDA onlyIDA totalIndiaIndonesiaIran, Islamic Rep.IrelandIsraelItalyJamaicaJapanJordanKazakhstanKenyaKorea, Rep.KosovoKuwaitKyrgyz RepublicLao PDRLate-demographic dividendLatin America & Caribbean Latin America & Caribbean (excluding high income)Latin America & the Caribbean (IDA & IBRD countries)LatviaLeast developed countries: UN classificationLebanonLiberiaLithuaniaLow & middle incomeLow incomeLower middle incomeLuxembourgMacao SAR, ChinaMacedonia, FYRMadagascarMalawiMalaysiaMaliMaltaMauritaniaMauritiusMexicoMiddle East & North AfricaMiddle East & North Africa (excluding high income)Middle East & North Africa (IDA & IBRD countries)Middle incomeMoldovaMongoliaMontenegroMoroccoMozambiqueNamibiaNepalNetherlandsNew ZealandNicaraguaNigerNigeriaNorth AmericaNorwayOECD membersOmanOther small statesPakistanPanamaPapua New GuineaParaguayPeruPhilippinesPolandPortugalPost-demographic dividendPre-demographic dividendPuerto RicoQatarRomaniaRussian FederationRwandaSaudi ArabiaSenegalSerbiaSeychellesSierra LeoneSingaporeSlovak RepublicSloveniaSmall statesSomaliaSouth AfricaSouth AsiaSouth Asia (IDA & IBRD)South SudanSpainSri LankaSub-Saharan Africa Sub-Saharan Africa (excluding high income)Sub-Saharan Africa (IDA & IBRD countries)SudanSurinameSwazilandSwedenSwitzerlandSyrian Arab RepublicTajikistanTanzaniaThailandTimor-LesteTogoTrinidad and TobagoTunisiaTurkeyTurkmenistanUgandaUkraineUnited Arab EmiratesUnited KingdomUnited StatesUpper middle incomeUruguayVanuatuVenezuela, RBVietnamWest Bank and GazaWorldZimbabwe Timeline:
This timeline shows a graph from 1984 to 2016 of Macao SAR, China. No data until 1983. Number of actual observations by date: 33.
Source name:
World Development Indicators
Source organization:
World Bank national accounts data, and OECD National Accounts data files.
Categories, topics:
Economy & Growth
Last updated:
apr 23, 2017
Indicators value changes by year
Maximum:
14.715
jan 1, 2014
At the date of observation
Value
Absolute change
Change from previous value
jan 1, 1985
4.6
-1.5
-24.59%
jan 1, 1986
6.2
+1.6
34.78%
jan 1, 1987
8.9
+2.7
43.55%
jan 1, 1988
8.6
-0.3
-3.37%
jan 1, 1990
4.3
-5.1
-54.26%
jan 1, 1991
5.6
+1.3
30.23%
jan 1, 1992
7.2
+1.6
28.57%
jan 1, 1993
8.8
+1.6
22.22%
jan 1, 1994
6.5
-2.3
-26.14%
jan 1, 1995
6.1
-0.4
-6.15%
jan 1, 1996
2.8
-3.3
-54.1%
jan 1, 1997
4.0
+1.2
42.86%
jan 1, 1998
1.4
-2.6
-65.0%
jan 1, 1999
-1.0
-2.4
-171.43%
jan 1, 2000
2.5
+3.5
-350.0%
jan 1, 2001
-1.0
-3.5
-140.0%
jan 1, 2002
1.9
+2.9
-290.0%
jan 1, 2003
5.579
+3.679
193.63%
jan 1, 2004
3.337
-2.242
-40.19%
jan 1, 2005
8.268
+4.931
147.8%
jan 1, 2006
6.122
-2.146
-25.96%
jan 1, 2007
6.15
+0.029
0.47%
jan 1, 2008
9.639
+3.489
56.72%
jan 1, 2009
5.18
-4.459
-46.26%
jan 1, 2010
2.369
-2.811
-54.26%
jan 1, 2011
7.24
+4.871
205.59%
jan 1, 2012
11.025
+3.785
52.27%
jan 1, 2013
8.706
-2.319
-21.04%
jan 1, 2014
14.715
+6.01
69.03%
jan 1, 2015
5.693
-9.023
-61.32%
jan 1, 2016
2.438
-3.254
-57.16%
Ranking of countries by current statistics by years


Comments: