29
/
en
AIzaSyAYiBZKx7MnpbEhh9jyipgxe19OcubqV5w
April 1, 2024
235866
Senegal
SEN
true
2
1
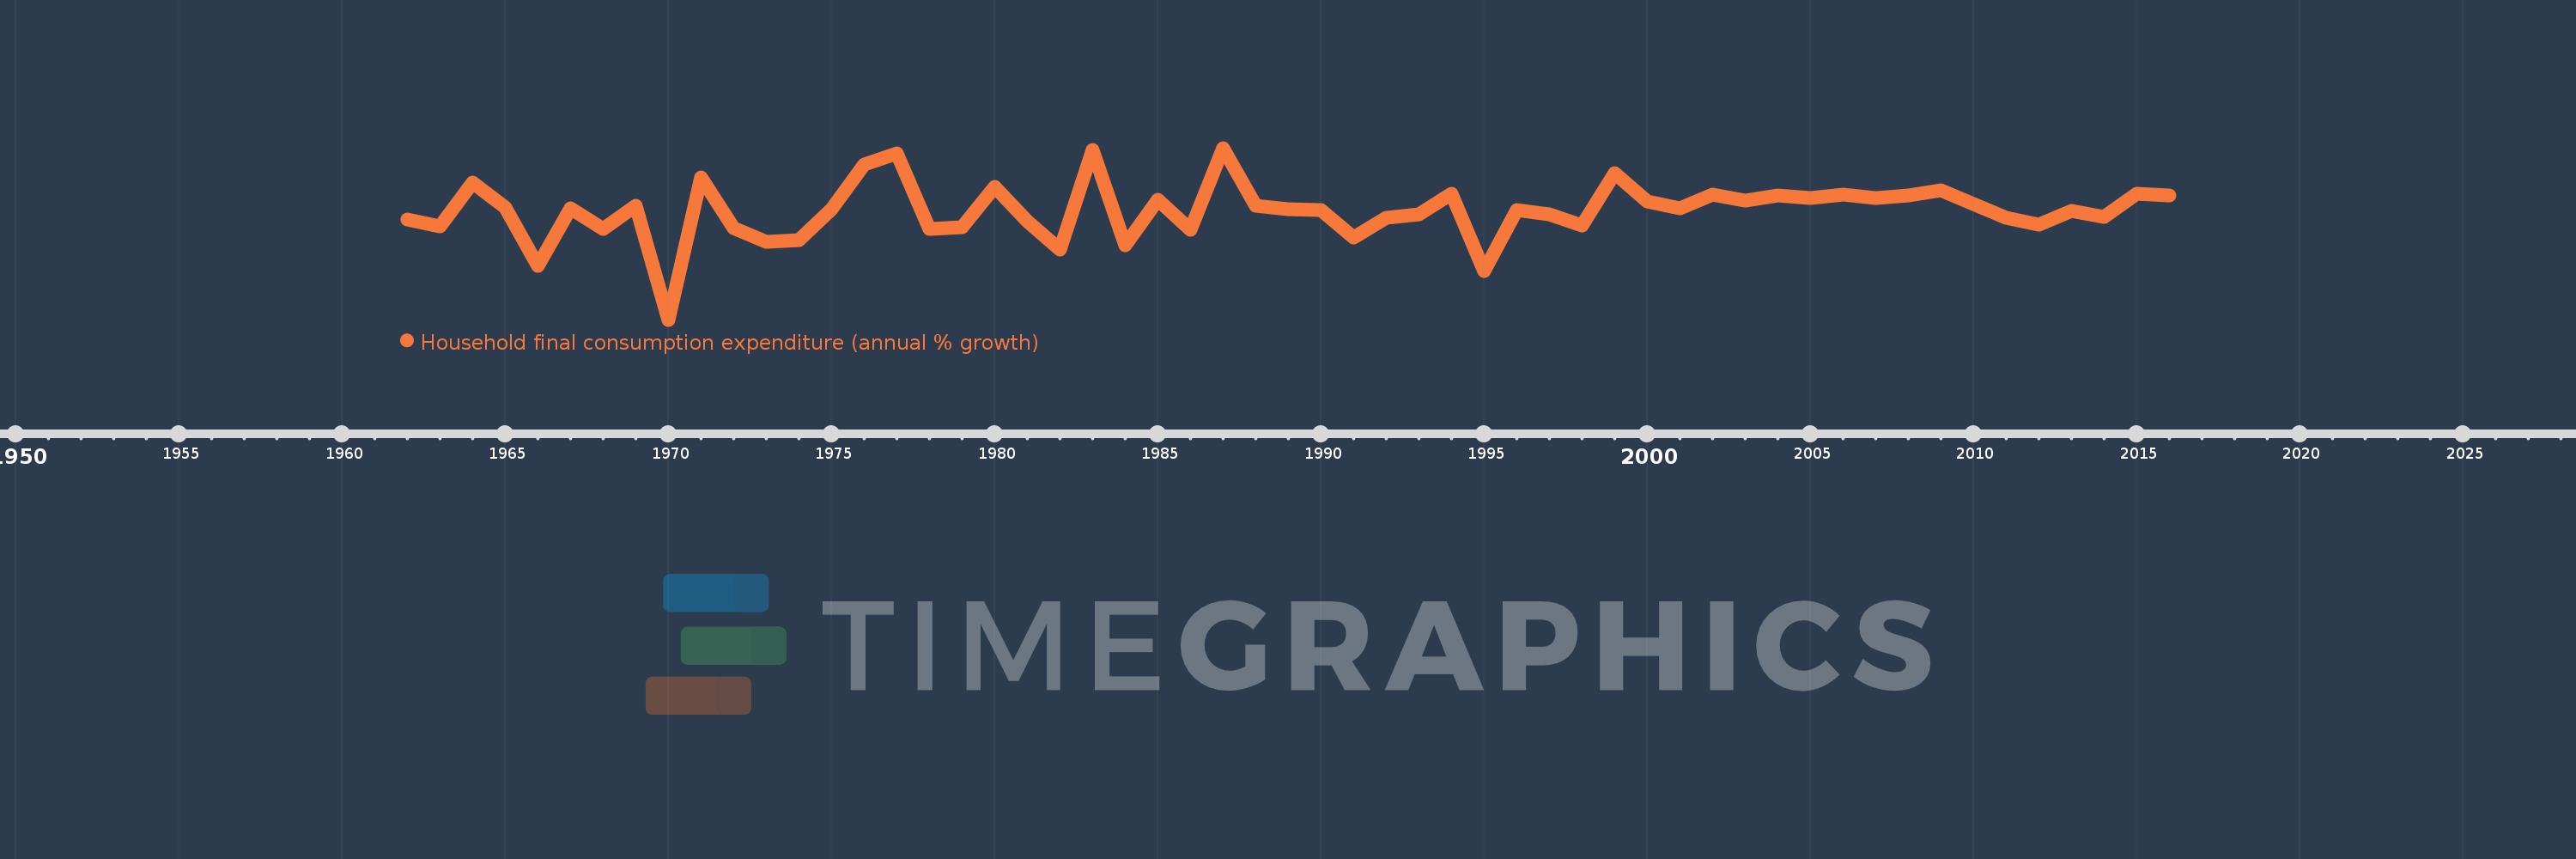
Household final consumption expenditure (annual % growth)
2016,2015,2014,2013,2012,2011,2010,2009,2008,2007,2006,2005,2004,2003,2002,2001,2000,1999,1998,1997,1996,1995,1994,1993,1992,1991,1990,1989,1988,1987,1986,1985,1984,1983,1982,1981,1980,1979,1978,1977,1976,1975,1974,1973,1972,1971,1970,1969,1968,1967,1966,1965,1964,1963,1962
This statistics in other country:
AlbaniaAlgeriaAntigua and BarbudaArab WorldArgentinaArmeniaAustraliaAustriaAzerbaijanBahamas, TheBahrainBangladeshBarbadosBelarusBelgiumBelizeBeninBhutanBoliviaBosnia and HerzegovinaBotswanaBrazilBrunei DarussalamBulgariaBurkina FasoBurundiCabo VerdeCambodiaCameroonCanadaCaribbean small statesCentral Europe and the BalticsChadChileChinaColombiaComorosCongo, Dem. Rep.Congo, Rep.Costa RicaCote d'IvoireCroatiaCubaCyprusCzech RepublicDenmarkDominican RepublicEarly-demographic dividendEast Asia & PacificEast Asia & Pacific (excluding high income)East Asia & Pacific (IDA & IBRD countries)EcuadorEgypt, Arab Rep.El SalvadorEquatorial GuineaEritreaEstoniaEthiopiaEuro areaEurope & Central AsiaEurope & Central Asia (excluding high income)Europe & Central Asia (IDA & IBRD countries)European UnionFinlandFranceGabonGambia, TheGeorgiaGermanyGhanaGreeceGuatemalaGuineaGuinea-BissauHaitiHeavily indebted poor countries (HIPC)High incomeHondurasHong Kong SAR, ChinaHungaryIBRD onlyIcelandIDA & IBRD totalIDA blendIDA onlyIDA totalIndiaIndonesiaIran, Islamic Rep.IrelandIsraelItalyJamaicaJapanJordanKazakhstanKenyaKorea, Rep.KosovoKuwaitKyrgyz RepublicLao PDRLate-demographic dividendLatin America & Caribbean Latin America & Caribbean (excluding high income)Latin America & the Caribbean (IDA & IBRD countries)LatviaLeast developed countries: UN classificationLebanonLiberiaLithuaniaLow & middle incomeLow incomeLower middle incomeLuxembourgMacao SAR, ChinaMacedonia, FYRMadagascarMalawiMalaysiaMaliMaltaMauritaniaMauritiusMexicoMiddle East & North AfricaMiddle East & North Africa (excluding high income)Middle East & North Africa (IDA & IBRD countries)Middle incomeMoldovaMongoliaMontenegroMoroccoMozambiqueNamibiaNepalNetherlandsNew ZealandNicaraguaNigerNigeriaNorth AmericaNorwayOECD membersOmanOther small statesPakistanPanamaPapua New GuineaParaguayPeruPhilippinesPolandPortugalPost-demographic dividendPre-demographic dividendPuerto RicoQatarRomaniaRussian FederationRwandaSaudi ArabiaSenegalSerbiaSeychellesSierra LeoneSingaporeSlovak RepublicSloveniaSmall statesSomaliaSouth AfricaSouth AsiaSouth Asia (IDA & IBRD)South SudanSpainSri LankaSub-Saharan Africa Sub-Saharan Africa (excluding high income)Sub-Saharan Africa (IDA & IBRD countries)SudanSurinameSwazilandSwedenSwitzerlandSyrian Arab RepublicTajikistanTanzaniaThailandTimor-LesteTogoTrinidad and TobagoTunisiaTurkeyTurkmenistanUgandaUkraineUnited Arab EmiratesUnited KingdomUnited StatesUpper middle incomeUruguayVanuatuVenezuela, RBVietnamWest Bank and GazaWorldZimbabwe Timeline:
This timeline shows a graph from 1962 to 2016 of Senegal. No data until 1961. Number of actual observations by date: 55.
Source name:
World Development Indicators
Source organization:
World Bank national accounts data, and OECD National Accounts data files.
Categories, topics:
Economy & Growth
Last updated:
apr 23, 2017
Indicators value changes by year
Minimum:
-10.573
jan 1, 1970
Maximum:
10.899
jan 1, 1987
At the date of observation
Value
Absolute change
Change from previous value
jan 1, 1962
1.97
+1.97
0.0%
jan 1, 1963
1.066
-0.904
-45.89%
jan 1, 1964
6.526
+5.46
512.22%
jan 1, 1965
3.465
-3.061
-46.9%
jan 1, 1966
-3.828
-7.293
-210.46%
jan 1, 1967
3.344
+7.172
-187.37%
jan 1, 1968
0.82
-2.524
-75.49%
jan 1, 1969
3.623
+2.804
341.99%
jan 1, 1970
-10.573
-14.196
-391.79%
jan 1, 1971
7.174
+17.746
-167.85%
jan 1, 1972
0.876
-6.297
-87.79%
jan 1, 1973
-0.783
-1.659
-189.38%
jan 1, 1974
-0.588
+0.195
-24.87%
jan 1, 1975
3.248
+3.837
-652.03%
jan 1, 1976
8.809
+5.561
171.19%
jan 1, 1977
10.229
+1.42
16.12%
jan 1, 1978
0.804
-9.424
-92.14%
jan 1, 1979
1.029
+0.225
27.96%
jan 1, 1980
6.055
+5.026
488.28%
jan 1, 1981
1.706
-4.349
-71.82%
jan 1, 1982
-1.79
-3.496
-204.92%
jan 1, 1983
10.659
+12.449
-695.53%
jan 1, 1984
-1.285
-11.944
-112.05%
jan 1, 1985
4.449
+5.734
-446.3%
jan 1, 1986
0.637
-3.812
-85.68%
jan 1, 1987
10.899
+10.262
1.61K%
jan 1, 1988
3.696
-7.203
-66.09%
jan 1, 1989
3.204
-0.491
-13.3%
jan 1, 1990
3.178
-0.027
-0.83%
jan 1, 1991
-0.291
-3.469
-109.15%
jan 1, 1992
2.218
+2.509
-862.61%
jan 1, 1993
2.64
+0.422
19.01%
jan 1, 1994
5.202
+2.562
97.04%
jan 1, 1995
-4.443
-9.644
-185.41%
jan 1, 1996
3.13
+7.573
-170.45%
jan 1, 1997
2.649
-0.481
-15.37%
jan 1, 1998
1.257
-1.392
-52.54%
jan 1, 1999
7.758
+6.501
517.08%
jan 1, 2000
4.229
-3.529
-45.49%
jan 1, 2001
3.349
-0.88
-20.81%
jan 1, 2002
5.026
+1.677
50.09%
jan 1, 2003
4.329
-0.697
-13.87%
jan 1, 2004
5.013
+0.684
15.8%
jan 1, 2005
4.636
-0.377
-7.53%
jan 1, 2006
5.082
+0.446
9.62%
jan 1, 2007
4.669
-0.413
-8.12%
jan 1, 2008
4.948
+0.279
5.97%
jan 1, 2009
5.636
+0.688
13.9%
jan 1, 2010
3.855
-1.781
-31.6%
jan 1, 2011
2.147
-1.708
-44.31%
jan 1, 2012
1.294
-0.853
-39.72%
jan 1, 2013
3.081
+1.787
138.08%
jan 1, 2014
2.297
-0.784
-25.45%
jan 1, 2015
5.161
+2.864
124.68%
jan 1, 2016
5.0
-0.161
-3.11%
Ranking of countries by current statistics by years


Comments: